Introduction
Myocardial infarction (MI), commonly referred to as a heart attack, is a leading cause of morbidity and mortality worldwide. Traditionally considered a condition of older adults, MI in young individuals presents unique challenges in terms of prevention, diagnosis, and management. The occurrence of MI in younger populations has profound implications, not only for individual health outcomes but also for public health systems, given the potential for long-term disability and economic impact during a productive phase of life [1, 2].
Despite advances in cardiovascular care, the burden of MI in younger populations remains underexplored. Understanding the epidemiology, risk factors, and trends of MI in this age group is essential to inform targeted prevention and intervention strategies. Previous studies have highlighted potential differences in risk factor profiles, including a higher prevalence of smoking, dyslipidemia, and psychosocial stress, compared to older cohorts [3–5]. However, disparities in outcomes based on demographic factors such as age, gender, race, and socioeconomic status remain under-characterized [6, 7].
The Centers for Disease Control and Prevention Wide-ranging Online Data for Epidemiologic Research (CDC WONDER) provides a valuable platform for analyzing population-level health outcomes, offering insights into demographic variations, temporal trends, and disparities in disease burden. This study utilized CDC WONDER to investigate the epidemiology of MI in young individuals, aiming to help develop tailored public health and clinical strategies to reduce the burden of early-onset cardiovascular disease [8].
Material and methods
Study setting and population
Deaths in the United States related to myocardial infarction (MI) among young adults were analyzed using data from the CDC WONDER (Centers for Disease Control and Prevention Wide-Ranging Online Data for Epidemiologic Research) database. CDC WONDER serves as a comprehensive repository of death certificate data from all fifty states and the District of Columbia.
MI was defined as a composite measure, encompassing deaths resulting from myocardial infarction (International Classification of Diseases, 10th Revision [ICD-10] codes I21 and I22) among adults aged 15–44 years of age. Since this study used publicly available, de-identified government data, approval from an institutional review board was not necessary. The research followed the Strengthening the Reporting of Observational Studies in Epidemiology (STROBE) guidelines to maintain methodological rigor [9].
Data abstraction
Data on MI-related deaths and population sizes were collected, along with demographic information (sex, race/ethnicity, and age) and regional details (urban-rural and state) from 1999 to 2023. Race/ethnicity categories included non-Hispanic (NH) white, NH Black or African American, NH others (such as NH Asian or Pacific Islander, NH American Indian or Alaska Native), and Hispanics or Latinos. These classifications have been used in previous analyses from the CDC WONDER database, based on death certificate data. Trends in mortality from MI in young adults were evaluated based on state-specific variations, US census regions (Northeast, Midwest, South, West), and county-level urbanization classifications. Counties were categorized as rural (micropolitan, noncore regions) or urban (large central metro, large fringe metro, medium metro, small metro) based on the 2013 National Centers for Health Statistics Urban-Rural Classification Scheme (10). Similar stratification has been used in prior administrative database studies [5, 10–13].
Statistical analysis
Crude and age-adjusted mortality rates per 100,000 population were calculated. Crude mortality rates (CMRs) were derived by dividing the total number of MI-related deaths by the US population for that year. Age-adjusted mortality rates (AAMRs) were computed by adjusting the MI-related deaths to match the 2000 US population, as outlined earlier [14]. The Joinpoint Regression Program (Joinpoint V 5.1.0.0, National Cancer Institute) was employed to analyze trends in both AAMRs and CMRs using annual percent change (APC) [15]. This method identifies significant changes in AAMRs and CMRs over time by fitting log-linear regression models to intervals where changes occurred. APCs, along with their 95% confidence intervals (CI), were calculated for the AAMRs and CMRs at the points where significant changes (joint points) occurred, using the Monte Carlo permutation test. The APCs were considered significant if the slope indicating the mortality change was statistically different from zero, based on 2-tailed t testing. Statistical significance was determined at p < 0.05.
Results
Overall
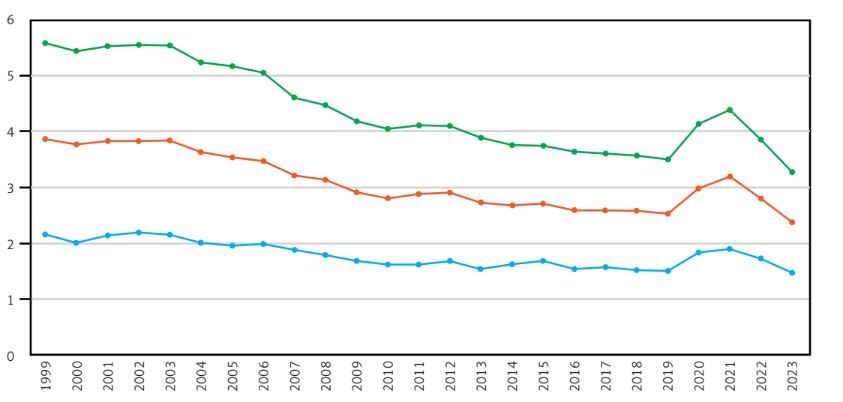
From 1999 to 2023, a total of 91,482 deaths among young adults in the United States were attributed to MI. The AAMR exhibited notable trends during this period. Initially, the AAMR remained stagnant from 1999 to 2003. However, a significant decline was observed between 2003 and 2009, with the AAMR decreasing from 3.84 to 2.92 annually, corresponding to an APC of –4.21* (95% CI: –6.34 to –3.30; p < 0.000001, Supplementary Table SI, Figure 1).
Figure 1
Overall and sex-stratified age-adjusted mortality rates (AAMRs) per 100,000 individuals in the United States, 1999 to 2023
This downward trend continued at a slower yet still significant rate from 2009 to 2018, as the AAMR dropped from 2.92 to 2.59, with an APC of –1.80* (95% CI: –2.55 to –0.55; p = 0.018). However, this was followed by a significant upward shift from 2018 to 2021, where the AAMR increased sharply from 2.59 to 3.2, reflecting an APC of 8.15* (95% CI: 5.41–9.80; p < 0.000001). From 2021 to 2023, the AAMR experienced a notable decline, dropping significantly from 3.2 to 2.38, with an APC of –13.36* (95% CI: –16.46 to –10.48; p < 0.000001, Supplementary Table SII).
Sex-stratified AAMR trends for MI in young adults
Throughout the study period, males consistently exhibited a significantly higher AAMR compared to females. Among males, the AAMR remained stable from 1999 to 2003. This was followed by a significant increase from 5.54 in 2003 to 4.19 in 2009, with an APC of 4.36* (95% CI: –6.47 to –3.47; p < 0.000001). Subsequently, the AAMR significantly decreased from 4.19 in 2009 to 3.58 in 2018, with an APC of -2.20* (95% CI: –2.90 to –0.82; p = 0.0116). A notable increase was then observed from 2018 to 2021, rising from 3.58 to 4.4 (APC = 7.99*, 95% CI: 5.36–9.65; p < 0.000001), followed by a sharp decline from 4.4 in 2021 to 3.28 in 2023 (APC = –13.37*, 95% CI: –16.54 to –10.54; p < 0.000001, Supplementary Table SIII).
For females, the AAMR showed a significant decline from 2.16 in 1999 to 1.51 in 2018, with an APC of -2.09* (95% CI: –2.66 to –1.62; p = 0.0228). The trend then remained stable from 2018 to 2021 and continued to stabilize from 2021 to 2023.
MI-related AAMR stratified by race/ethnicity in young adults
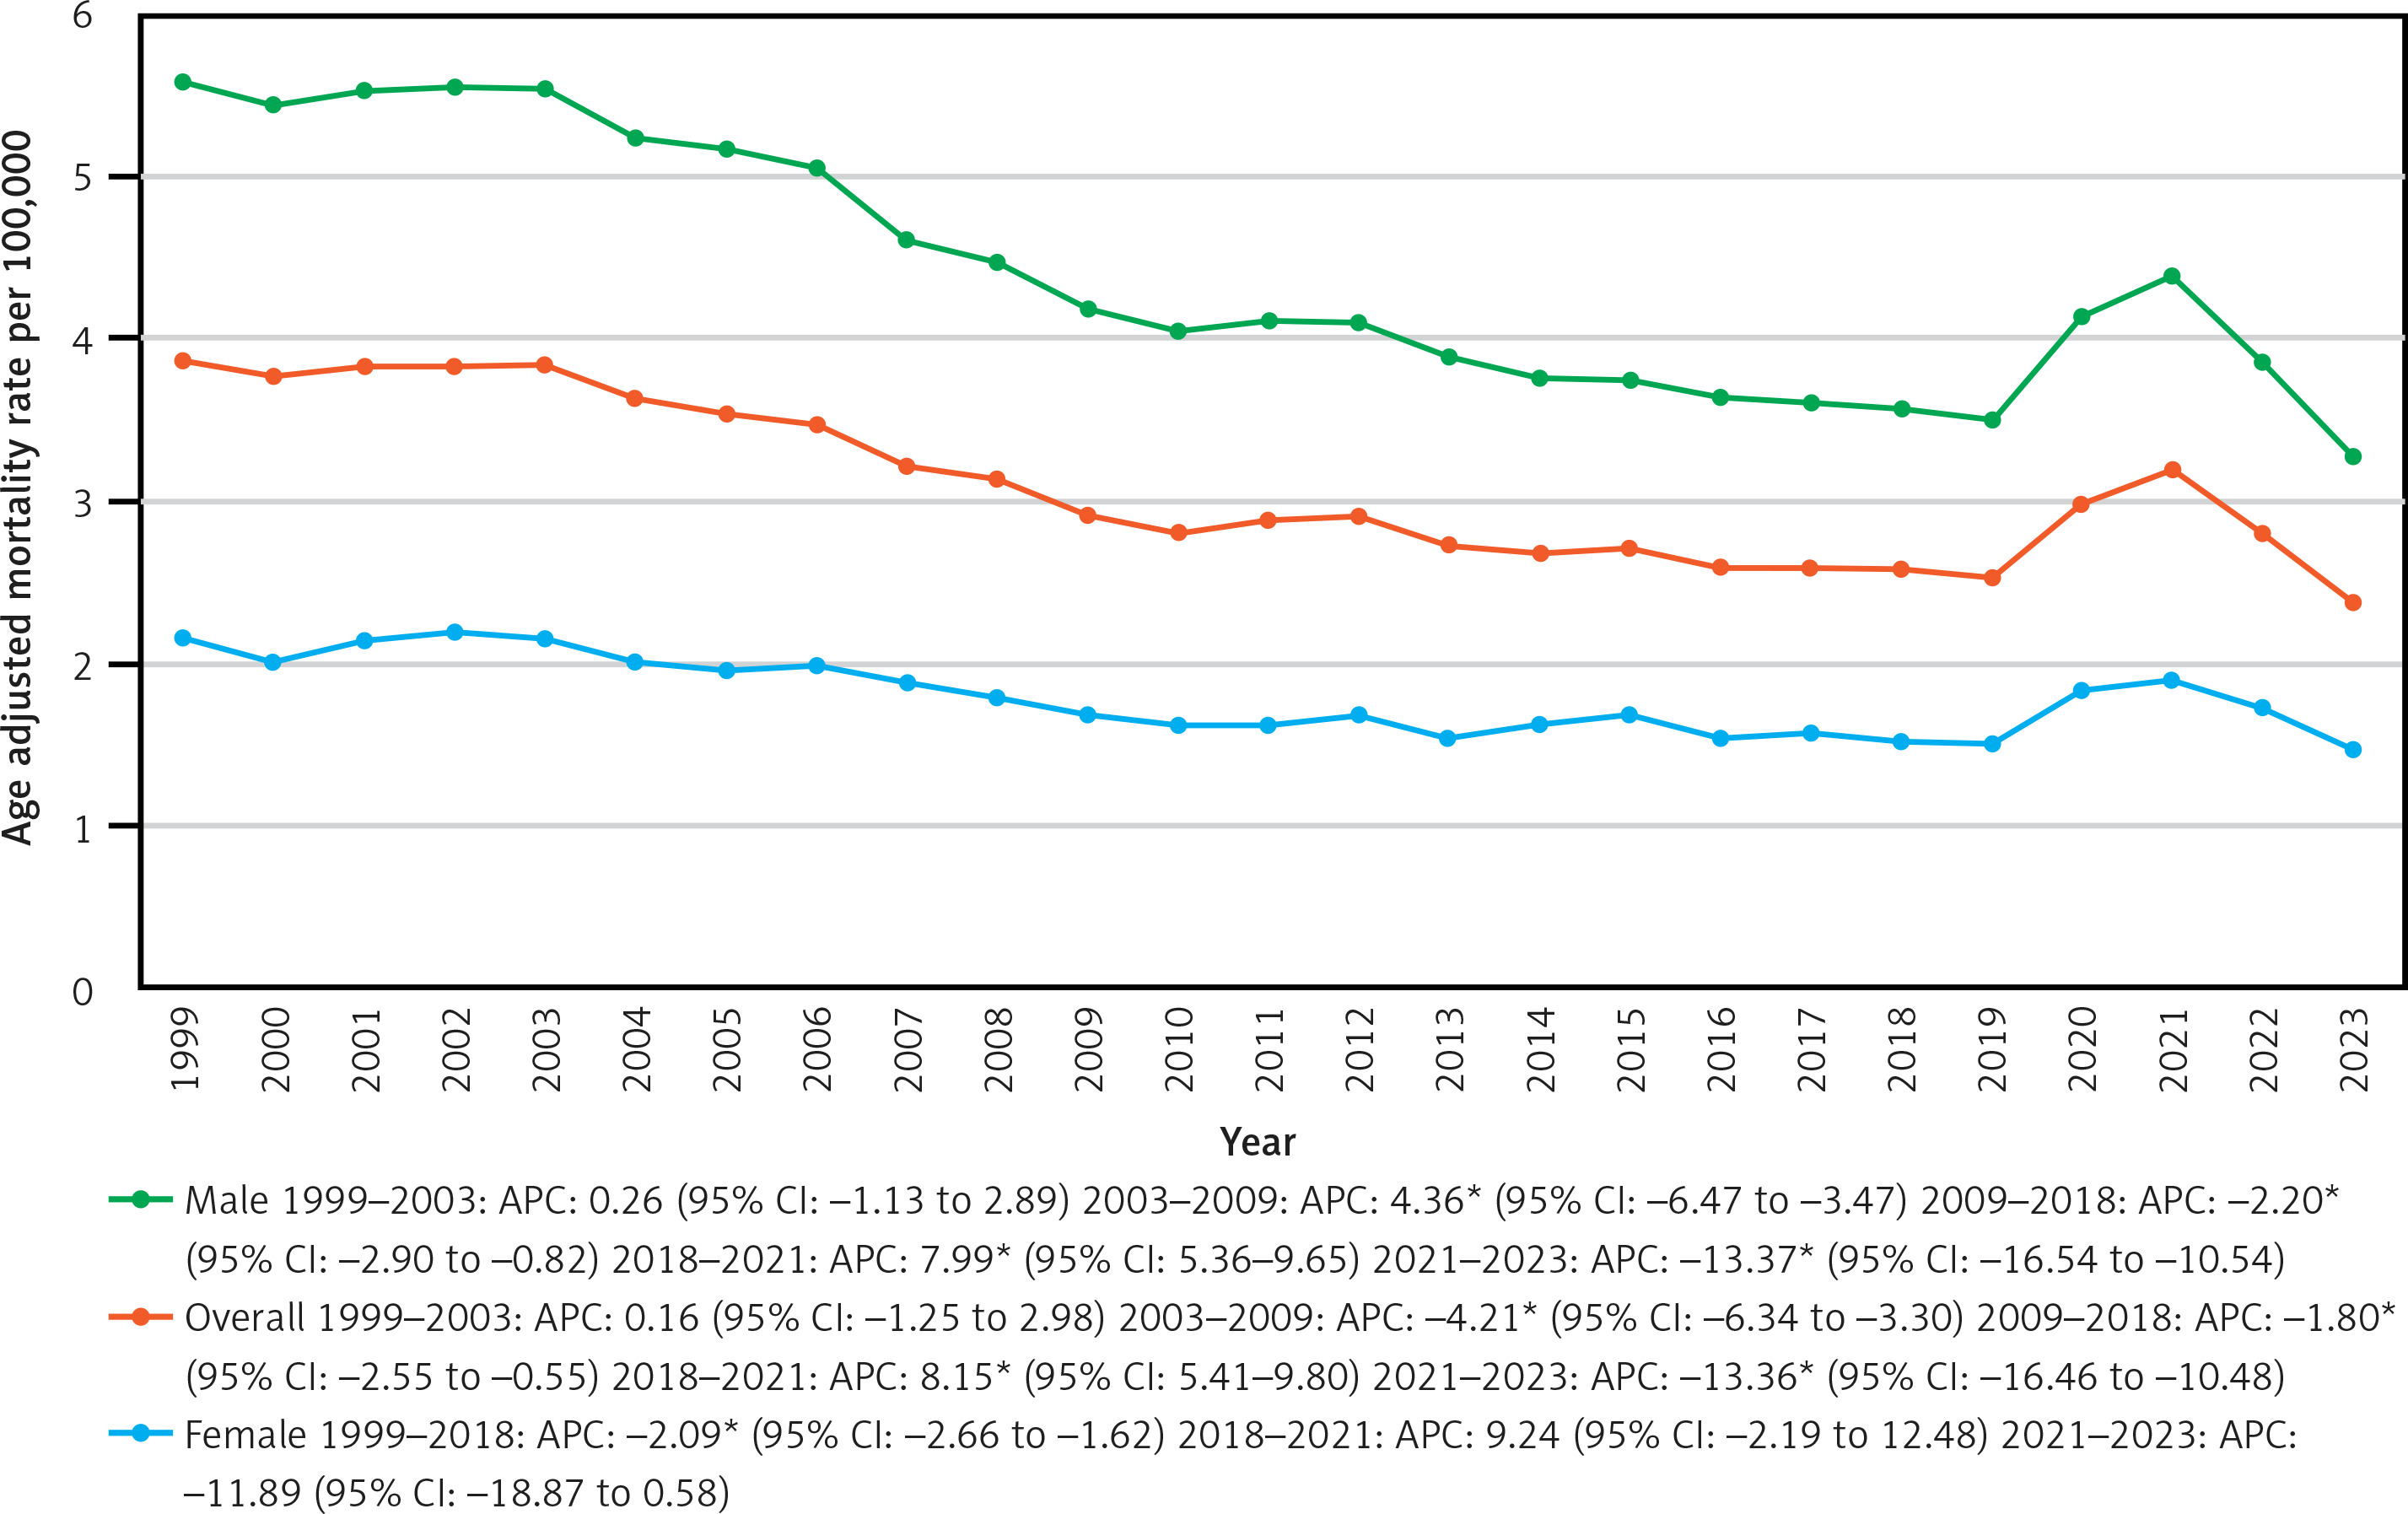
Over the study period, the highest AAMR was observed in the NH Black or African American group, followed by the NH White, Hispanic or Latino, and NH Other populations.
For the NH Black or African American population, AAMR remained stable from 1999 to 2014 and again from 2014 to 2018. A significant increase was observed from 4.51 in 2018 to 6.14 in 2021, with an APC of 11.16* (95% CI: 6.43–14.81; p < 0.000001). This was followed by a significant decrease from 6.14 in 2021 to 4.45 in 2023, with an APC of -13.50* (95% CI: –18.73 to –7.56; p < 0.000001, Figure 2).
Figure 2
Age-adjusted mortality rates (AAMRs) per 100,000 individuals stratified by race/ethnicity in the United States, 1999 to 2023
In the NH White population, the AAMR remained stable from 1999 to 2003. It then significantly decreased from 4.02 in 2003 to 2.71 in 2018, with an APC of –2.68* (95% CI: –3.78 to –2.38; p < 0.000001). From 2018 to 2021, it increased significantly from 2.71 to 3.14, with an APC of 5.89* (95% CI: 2.09–8.17; p = 0.0056), followed by a significant decrease from 3.14 in 2021 to 2.42 in 2023, with an APC of –11.16* (95% CI: –15.89 to –5.55; p < 0.000001).
For the Hispanic or Latino group, the AAMR remained stable from 1999 to 2005, then significantly decreased from 1.8 in 2005 to 1.22 in 2009, with an APC of –7.78* (95% CI: –12.03 to –3.89; p = 0.014). The trend remained stable from 2009 to 2018. From 2018 to 2021, the AAMR increased significantly from 1.36 to 2.15, with an APC of 15.57* (95% CI: 10.52–19.11; p < 0.000001), followed by a decrease from 2.15 in 2021 to 1.54 in 2023, with an APC of –17.05* (95% CI: –22.45 to –11.68; p < 0.000001).
Finally, in the NH Other population, AAMR decreased from 1.68 in 1999 to 1.45 in 2017, with an APC of –1.35* (95% CI: –3.48 to –0.53; p = 0.024). It then increased from 1.45 in 2017 to 1.91 in 2020, with an APC of 10.02* (95% CI: 0.83–14.62; p = 0.030), before decreasing again from 1.91 in 2020 to 1.3 in 2023, with an APC of –11.46* (95% CI: –21.83 to –4.78; p = 0.0228, Supplementary Table SIV).
MI-related AAMR in young adults stratified by geographical region
Statewide
Throughout the study period, significant statewide variation in MI-related mortality in young adults was observed. From 1999 to 2020, states falling within the top 90th percentile for mortality rates included Arkansas, Mississippi, Kentucky, Alabama, and Louisiana, while those in the bottom 10th percentile were Minnesota, Oregon, Massachusetts, Connecticut, and Utah. In the subsequent period from 2021 to 2023, the states with the highest mortality rates were Mississippi, Arkansas, South Dakota, Kentucky, Missouri, and Alabama, whereas New Hampshire, Colorado, Nevada, Minnesota, Connecticut, Massachusetts, and Alaska ranked in the lowest 10th percentile (Supplementary Table SV).
Census region
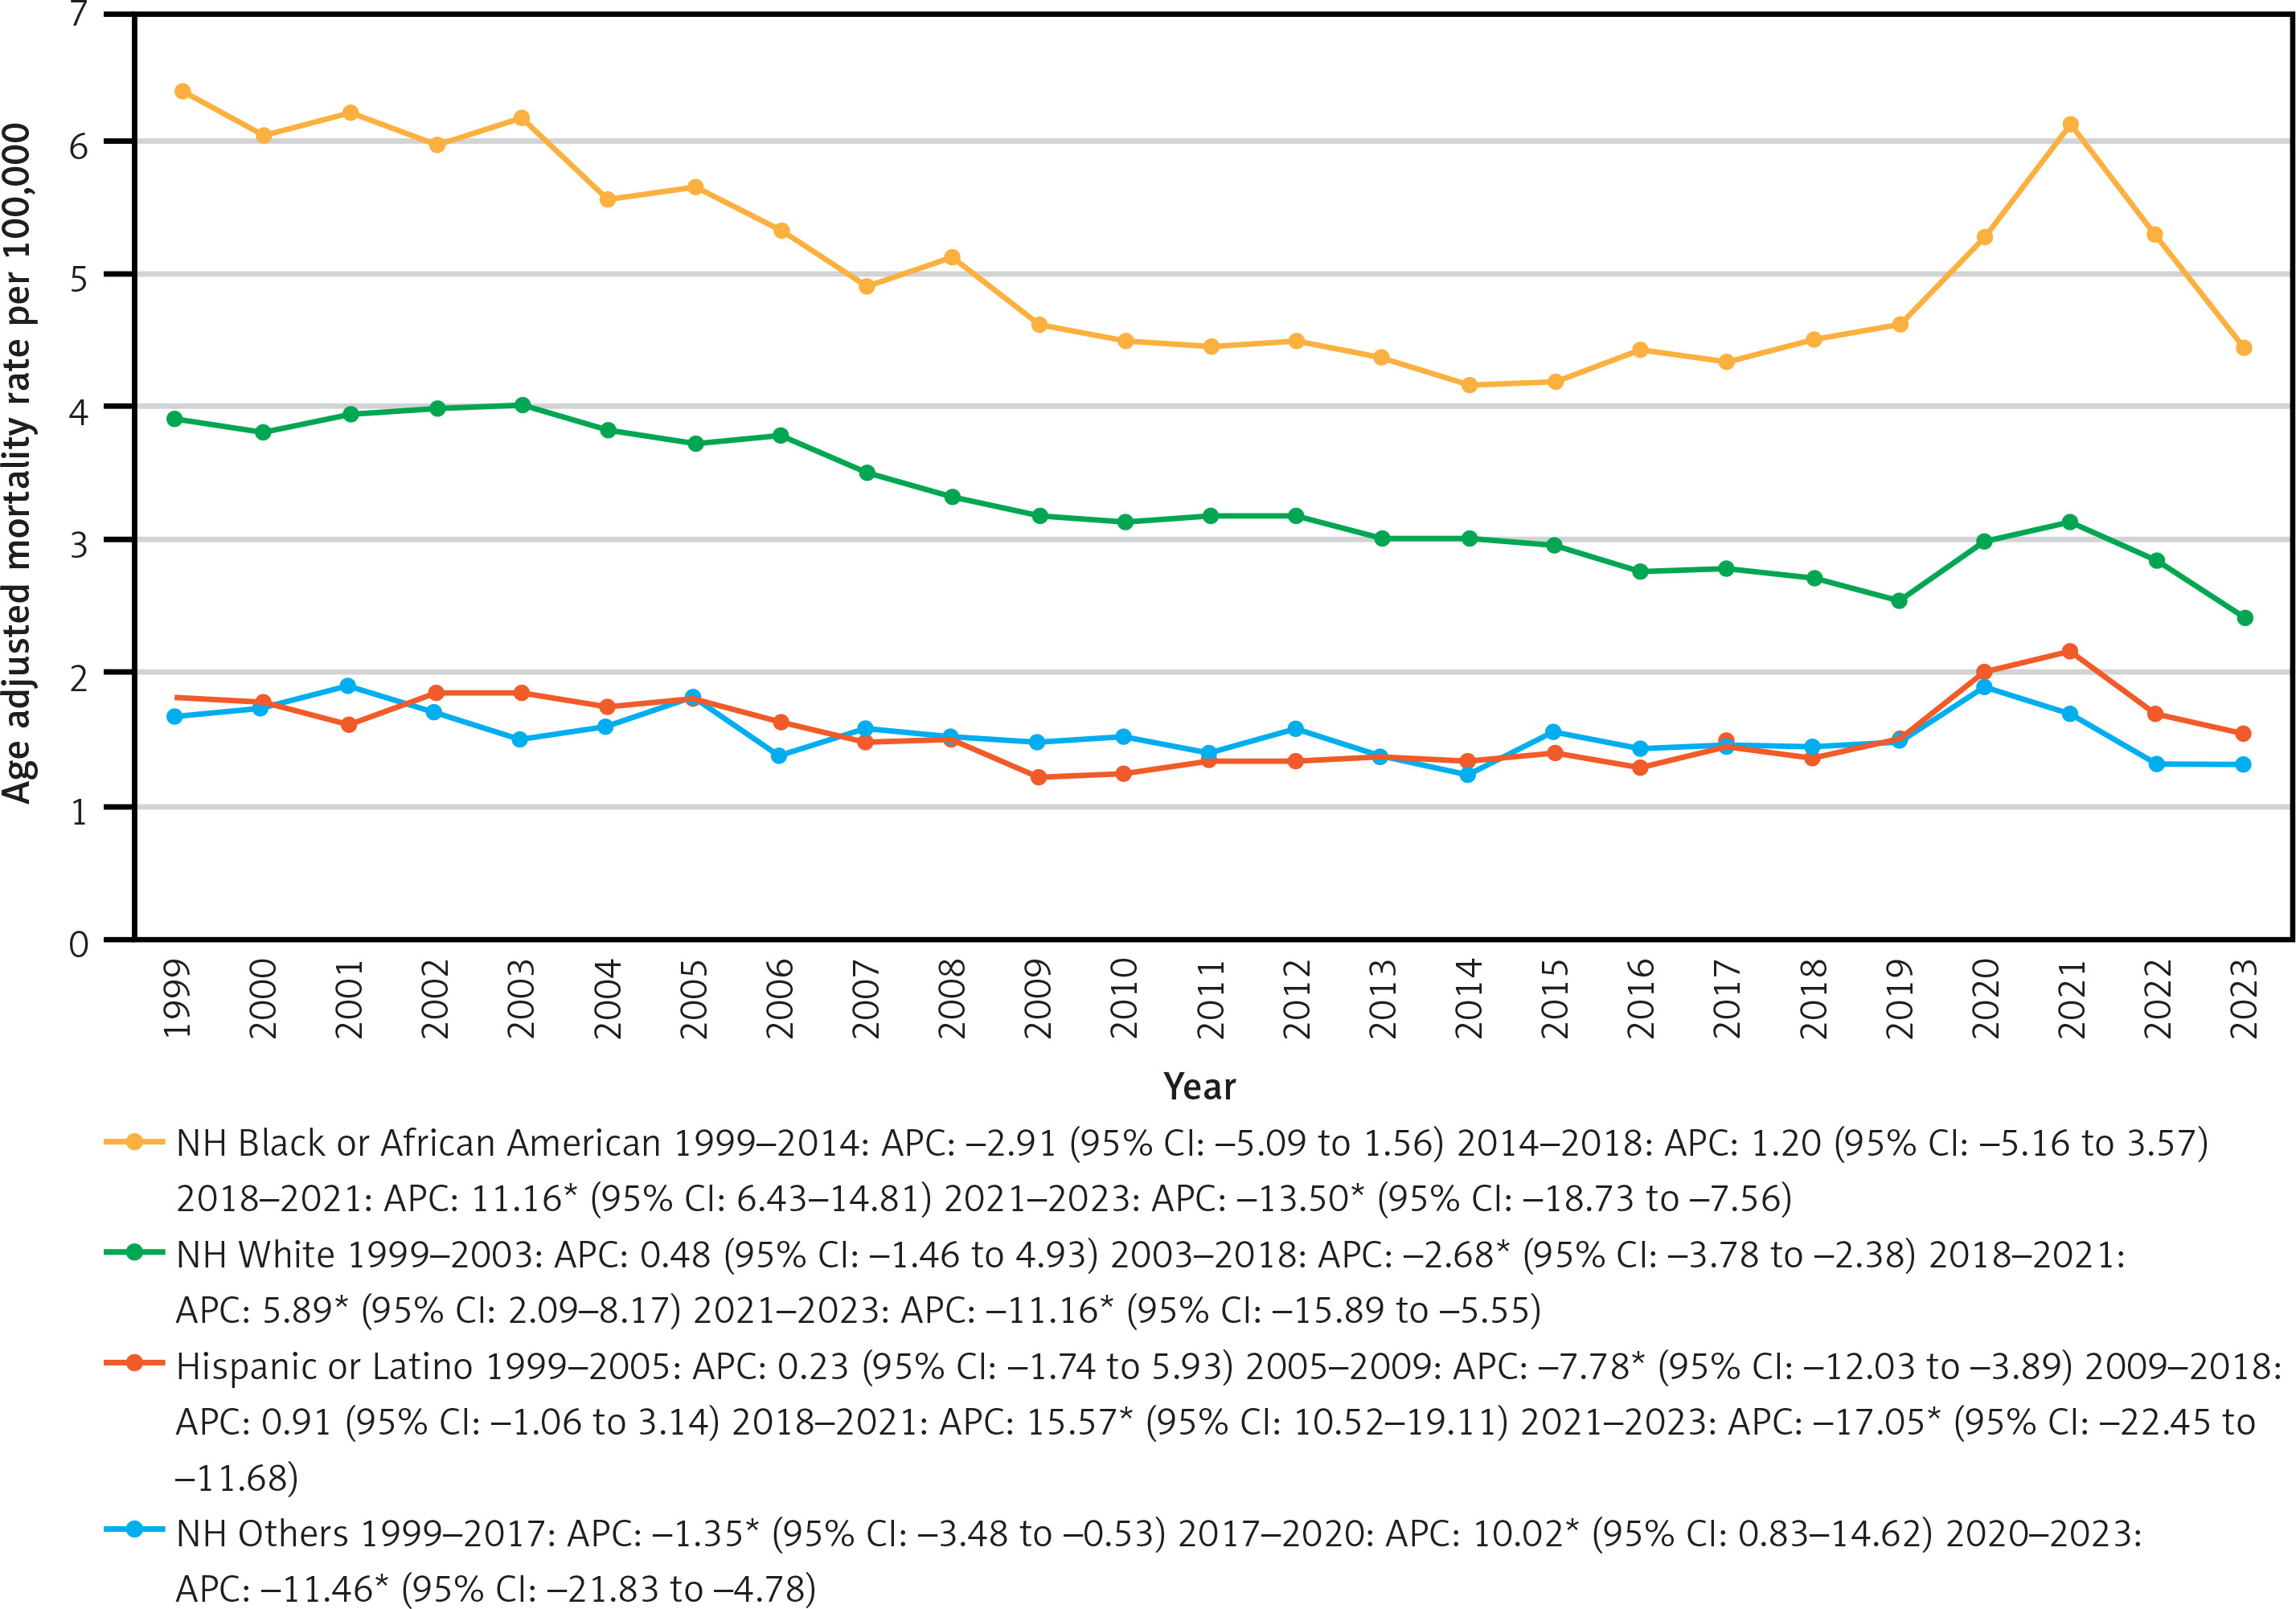
Between 1999 and 2023, the highest MI-related mortality rates were recorded in the South, followed by the Midwest, Northeast, and West regions. In the South, the AAMR remained stable from 1999 to 2005, continuing this trend through 2009 and 2017. A significant increase was observed from 2017 to 2021, rising from 3.6 to 4.45 (APC = 5.38*, 95% CI: 1.70–7.55; p = 0.0064), followed by a sharp decline from 2021 to 2023, dropping from 4.45 to 3.17 (APC = –13.59*, 95% CI: –19.83 to –6.69; p = 0.0032, Figure 3).
Figure 3
Age-adjusted mortality rates (AAMRs) per 100,000 individuals stratified by census region in the United States, 1999 to 2023
In the Midwest, the AAMR significantly decreased from 4.39 in 1999 to 2.93 in 2018 (APC = –2.53*, 95% CI: –2.98 to –2.21; p = 0.0112), followed by a stable trend from 2018 to 2021. A subsequent significant decline occurred from 2021 to 2023, with rates falling from 3.35 to 2.63 (APC = –10.10*, 95% CI: –15.73 to –0.91; p = 0.0348).
In the Northeast, the AAMR significantly declined from 2.87 in 1999 to 1.55 in 2017 (APC = –3.59*, 95% CI: –4.60 to –3.13; p < 0.000001) and then stabilized from 2017 to 2023.
In the West, the AAMR significantly decreased from 2.14 in 1999 to 1.51 in 2018 (APC = –2.20*, 95% CI: –2.69 to –1.82; p < 0.000001, Supplementary Table SVI). A sharp increase followed, rising from 1.51 in 2018 to 2.02 in 2021 (APC = 12.31*, 95% CI: 6.69–15.47; p = 0.0004), before significantly decreasing from 2021 to 2023, with rates dropping from 2.02 to 1.45 (APC = –15.42*, 95% CI: –21.49 to –9.08; p = 0.0004).
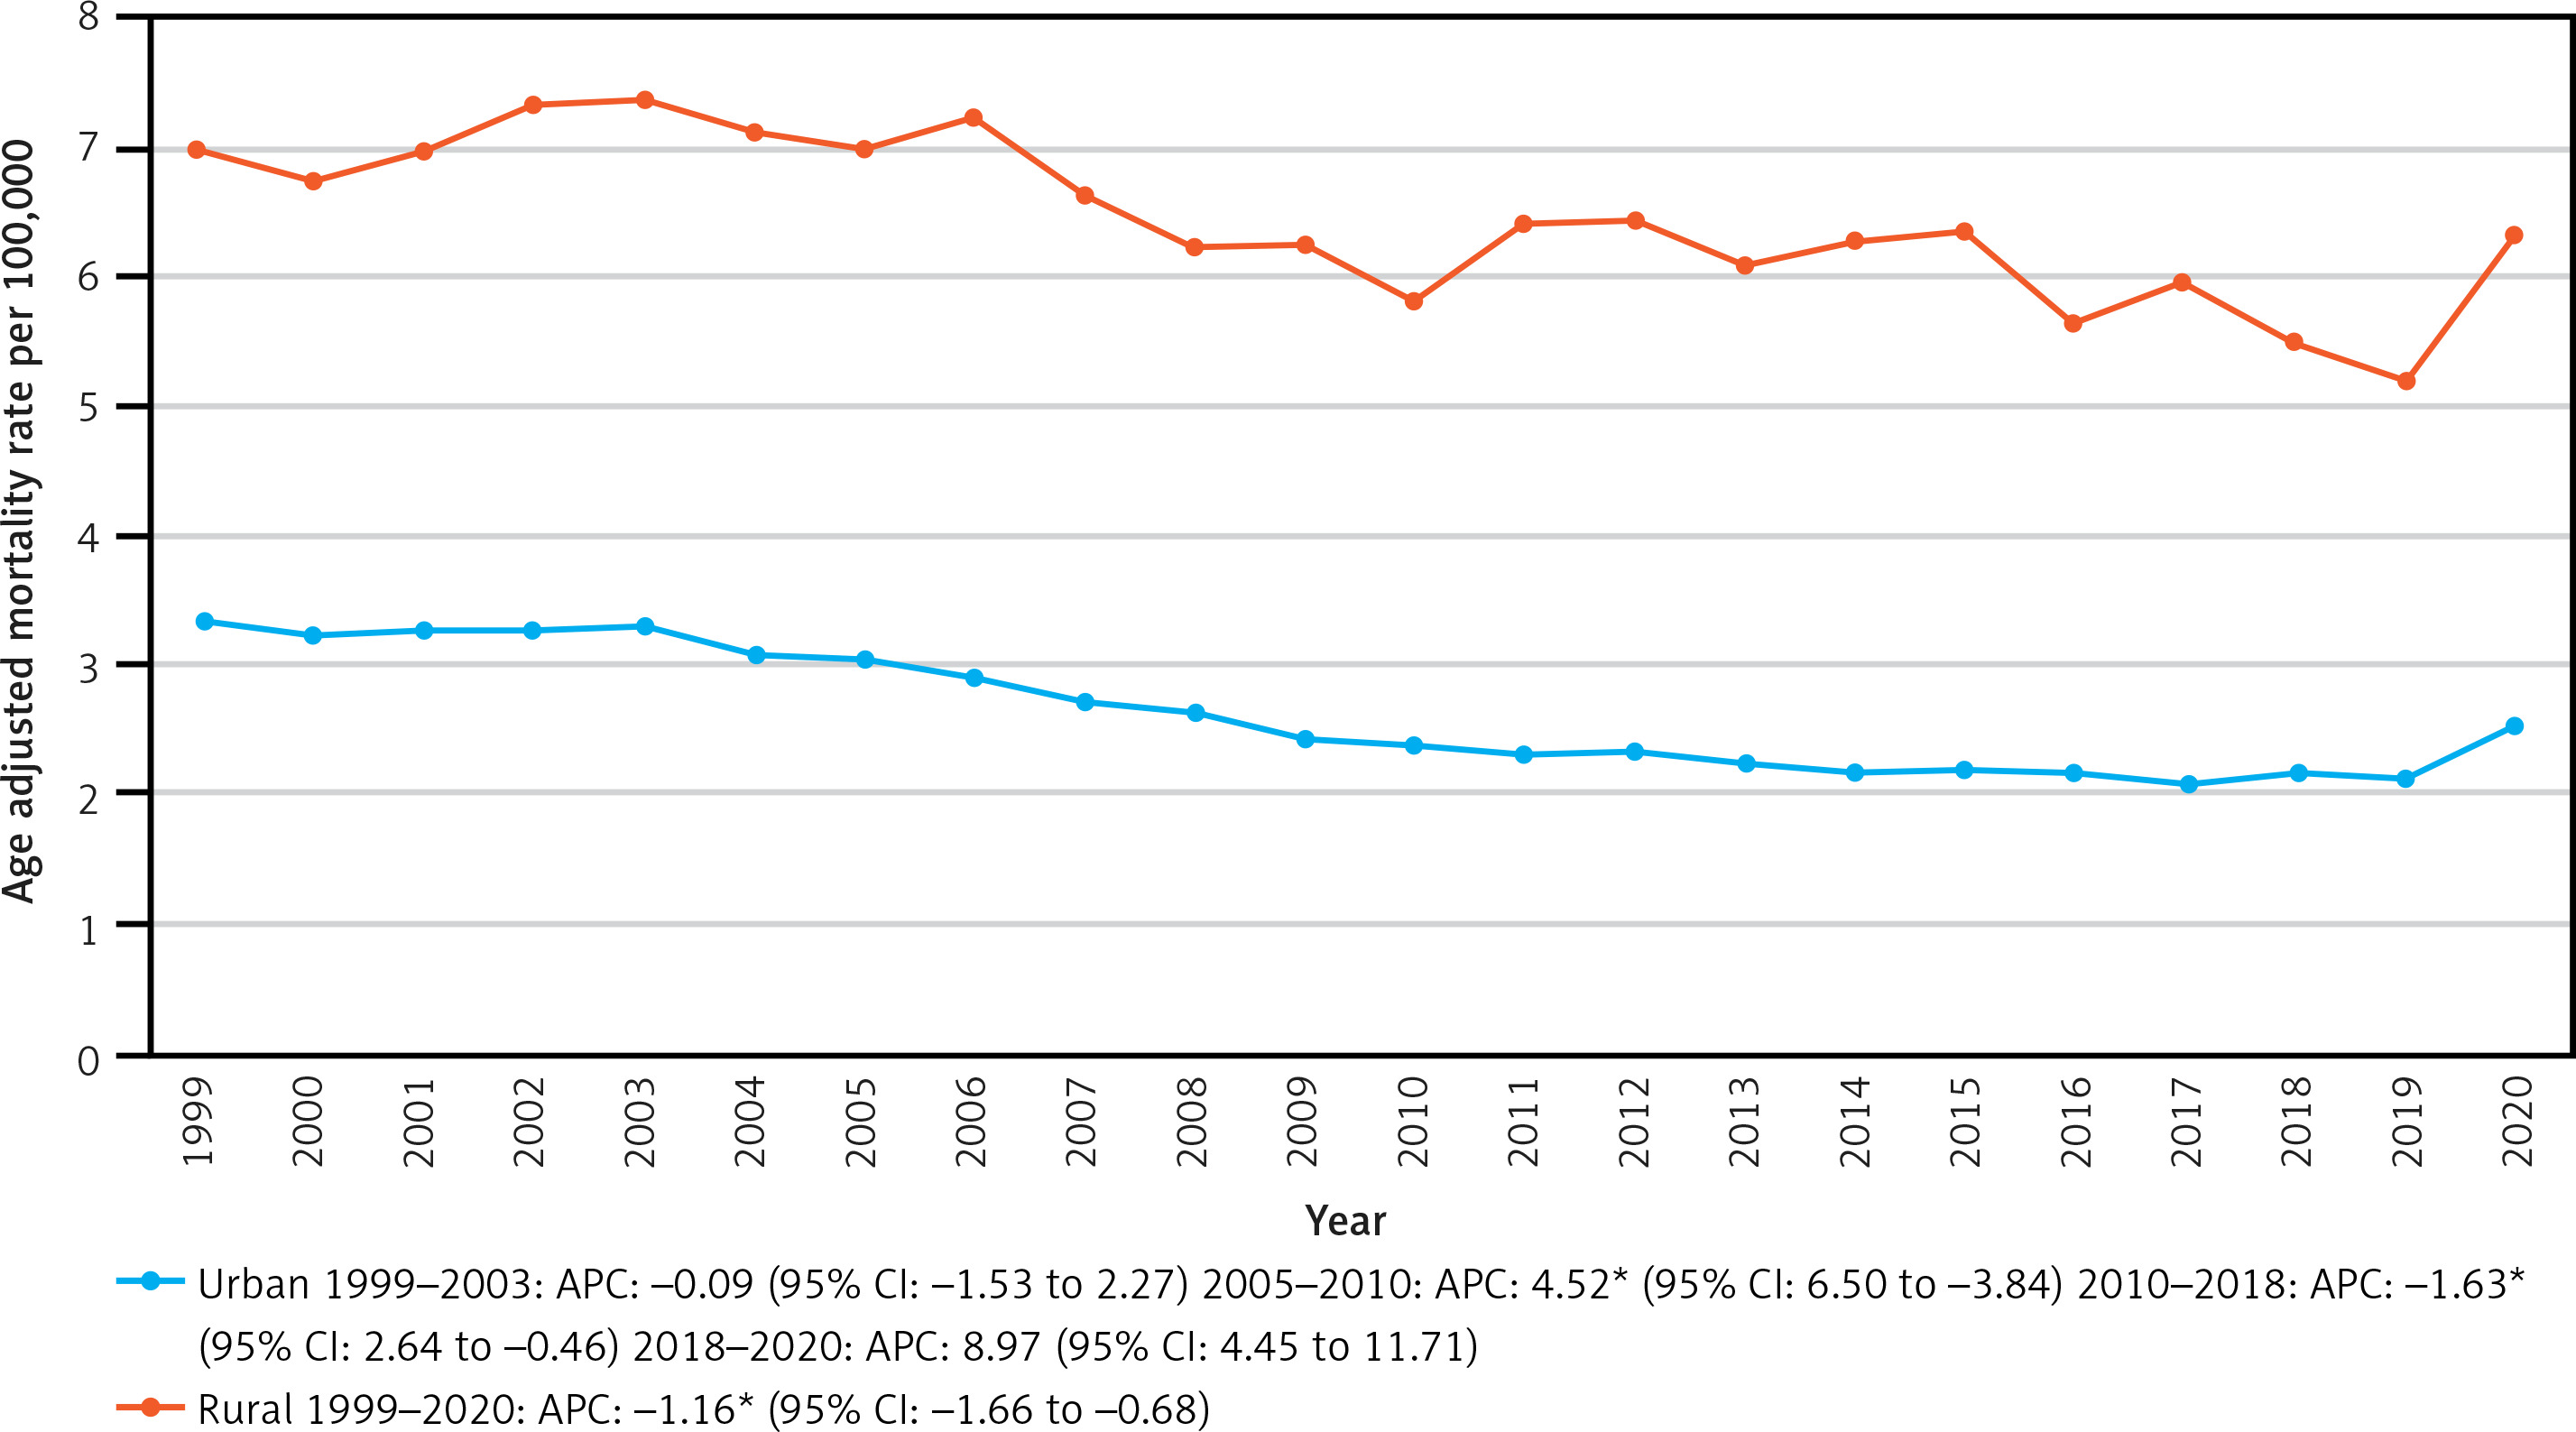
Urban-rural
Throughout the study period, rural areas consistently recorded a higher AAMR compared to urban areas. In urban regions, the AAMR remained stable from 1999 to 2003, followed by a significant increase from 3.04 in 2005 to 2.38 in 2010 (APC = 4.52*, 95% CI: 6.50 to –3.84; p < 0.000001). This was followed by a significant decrease from 2.38 in 2010 to 2.16 in 2018 (APC = –1.63*, 95% CI: 2.64 to –0.46; p = 0.0208, Supplementary Table SVII), with stability observed from 2018 to 2020. In rural areas, the AAMR showed a significant decline from 6.97 in 1999 to 6.33 in 2020 (APC = –1.16*, 95% CI: –1.66 to –0.68; p < 0.000001, Figure 4).
Discussion
This observational analysis of mortality trends attributed to MI among young adults in the United States from 1999 to 2023 revealed several crucial findings. First, the AAMR showed distinct phases, with an initial period of stability from 1999 to 2003, followed by a significant decline from 2003 to 2018, interrupted by a sharp rise between 2018 and 2021, and finally a steep reduction from 2021 to 2023. Second, males consistently demonstrated higher AAMRs compared to females, with notable variations in trends over time. Third, significant racial disparities were evident, as the highest AAMRs were observed in the NH Black or African American population, followed by NH White, Hispanic or Latino, and NH Other populations. Fourth, geographic disparities were prominent, with the South consistently recording the highest mortality rates across census regions and rural areas experiencing disproportionately higher AAMRs compared to urban settings.
Our study identified important demographic and regional disparities in MI mortality, revealing patterns that are often masked within aggregate cardiovascular disease (CVD) mortality data [5, 16]. While prior studies have noted a stagnation or slight increase in CVD mortality rates among middle-aged adults, we specifically observed that MI mortality rates have declined more slowly younger adults over the past two decades [17]. The higher prevalence of traditional cardiovascular risk factors such as hypertension, diabetes, and obesity in the middle-aged population likely drives this disparity. For example, during 2015–2016, hypertension prevalence was markedly higher in individuals aged 40–59 years (33.2%) compared with those aged 18–39 years (7.5%), emphasizing the disproportionate burden of cardiometabolic diseases in older adults [2, 18–20]. The rise in mortality from 2019 to 2021 can be attributed to the COVID-19 pandemic, which was associated with an increase in CVD mortality in the US. The COVID-19 pandemic put immense pressure on global healthcare systems, significantly disrupting medical care for US patients with CVD and worsening cardiovascular risk factors [21, 22].
Consistent with prior data, we found higher MI mortality rates in men compared with women, though both sexes exhibited comparable reductions in mortality over time. Additionally, MI mortality was notably higher in non-Hispanic (NH) Black adults compared with NH White adults. This racial disparity may be attributed to the higher prevalence of hypertension and diabetes in NH Black populations, compounded by socioeconomic factors such as lower access to healthcare, higher uninsured rates, and systemic inequities [23–25]. NH Black patients also experience reduced access to revascularization procedures, guideline-recommended medical therapy, and poorer post-AMI outcomes, even after adjusting for clinical characteristics [26–29]. These findings underscore the urgent need to address healthcare disparities and improve equitable access to cardiovascular care, particularly among racial and ethnic minorities.
Regional disparities were also evident, with higher MI mortality observed in the Southern states and rural counties compared with other regions and urban areas. The Southern states’ higher burden of cardiovascular risk factors – including obesity, smoking, hypertension, and physical inactivity – likely contributes to these findings [30, 31]. For instance, states such as Mississippi, Arkansas, and Kentucky report some of the nation’s highest rates of obesity and physical inactivity. Furthermore, socioeconomic factors, including education, employment, and healthcare access, significantly influence these trends. Notably, most high-mortality Southern states were slow to adopt Medicaid expansion under the Patient Protection and Affordable Care Act, which likely limited access to care for nonelderly adults and exacerbated existing disparities [32, 33]. The rural-urban gap in CVD mortality, which has doubled over the past two decades, reflects the same unequal distribution of socioeconomic and health resources between these regions [32].
This study has several limitations. First, the reliance on death certificate data introduces the potential for misclassification of cause of death based on ICD-10 codes. However, prior studies have shown that discrepancies between death certificates and physician-adjudicated causes of death are minimal among nonelderly adults and are unlikely to significantly impact observed trends. Additionally, the database lacks detailed information on clinical and social determinants of health, which restricts our ability to directly attribute disparities to specific variables. Finally, as the database assigns deaths to the state of residence, it does not account for migration between states, which could marginally influence regional mortality rates.
In conclusion, mortality rates due to MI among young adults in the US decreased from 1999 to 2018, followed by a spike between 2018 and 2021 mainly during the COVID-19 pandemic, and then fell sharply to pre-pandemic levels. Men had consistently higher death rates than women, while racial disparities showed that NH Black individuals had the highest rates. Geographically, the South and rural areas had higher AAMR, highlighting the need for targeted interventions.