
Introduction
Acute myocardial infarction (AMI) is one of the most fatal conditions, causing significant morbidity and mortality worldwide, with wide public health manifestations [1]. Often attributed to lifestyle choices, genetics, and pre-existing health conditions, obesity is probably the most important independent risk factor contributing to the increased burden of cardiovascular diseases [2]. Generally, obesity is associated with multiple cardiovascular risk factors, including hypertension, dyslipidemia, and insulin resistance, all of which increase the likelihood of triggering AMI [2, 3]. With the rising concern over obesity globally, it is crucial to review its precise impact on AMI-related deaths and the contribution to health outcomes of nations and regions.
Obesity has been reported as an independent risk factor for the increased incidence of AMI and worse post-attack outcomes [4]. Though this area has received considerable discussion and research, not much evidence is available as regards AMI mortality trends in obese populations specifically. A study analyzing trends AMI mortality at aged 65 in the United States found a steady increase in AMI-related deaths from 1999 to 2020 [5]. Another study in Germany evaluated mortality trends and fatality rate from 2004 to 2015 [6]. A similar trend was noted in 52 other countries [7], where rising obesity rates have led to higher cardiovascular disease mortality. Another study [8] in Japan examined the clinical outcomes of AMI patients based on body mass index (BMI). A study in Iceland described the mortality pattern of AMI in the young population associated with obesity [9]. Obesity is associated with premature events of AMI [10]. The mortality trends associated with this modifiable risk factor should be determined for epidemiological purposes.
This paper attempts to bridge the gap and assess the trends in AMI mortality in obese populations in the USA. This study highlights the growing impact of obesity on gender, geographical region, and age group on AMI mortality, underscoring the need for targeted public health interventions to address obesity-related cardiovascular risks.
Material and methods
Research setting and population
This retrospective study examined the CDC WONDER database to analyze AMI-related mortality among obese populations from 1999 to 2020 by using the ICD-10 code. AMI (ICD-10 code I21) includes the following subtypes: I21.0 (acute transmural myocardial infarction), I21.1 (acute subendocardial myocardial infarction), I21.2 (acute myocardial infarction with ST-elevation [STEMI]), I21.3 (acute myocardial infarction without ST-elevation [NSTEMI]), I21.4 (other acute myocardial infarction), and I21.9 (acute myocardial infarction, unspecified). Obesity was identified using ICD-10 code E66, including E66.0 (obesity due to excess calories), E66.1 (drug-induced obesity), E66.2 (extreme obesity with alveolar hypoventilation), E66.8 (other obesity), and E66.9 (obesity, unspecified) [11].
The ICD-10 code I21 is used for acute myocardial infarction, which is defined as occurring within 4 weeks (or 28 days) of onset. However, this code alone does not specify the exact time of death within that period [12].
The CDC Wonder dataset includes death cause information from the death certificates of the 50 U.S. states and the District of Columbia [13]. Mortality trends associated with AMI and obesity in all ages, genders, regions, and age groups were considered. Because this retrospective analysis used de-identified government public access data, this study did not require institutional review board approval and adhered to the STROBE (Strengthening the Reporting of Observational Studies in Epidemiology) guidelines for this study [14].
Data extraction
The dataset provided contains details on the population, year, location of death, demographics, an urban or rural classification, region, and state. The demographic factors are based on sex, age, race, and region. Race and ethnicity categories included non-Hispanic (NH) White, NH Black or African American, and Hispanic white. Urban-rural classification was based on the National Center for Health Statistics scheme and classified areas as urban (large metropolitan areas with a population exceeding 1 million), medium/small metropolitan areas, or rural populations under 50,000, in accordance with definitions from the 2013 U.S. Census [15, 16]. Regions were divided into Northeast, Midwest, South, and West, according to definitions made by the U.S. Census Bureau [17]. Socioeconomic data were not available in this dataset, but geographic proxies such as rural vs. urban areas were used according to the U.S. Census Bureau. Specific BMI values were not provided in CDC WONDER, limiting stratification by obesity severity.
Statistical analysis
To obtain national trends in AMI mortality among the obese, we computed crude mortality rates (CMR) and age-adjusted mortality rates (AAMR) per 100,000, stratifying for year, gender, race/ethnic background, state, and urban-rural status. CMR was computed by dividing the number of all deaths caused by AMI in particular settings of the year by the total U.S. population that each could be attributed to. AAMR were standardized specifically to the 2000 U.S. population [18]. To determine annual trends in AMI-related mortality, the Joinpoint Regression Program (Joinpoint V 4.9.0.0, National Cancer Institute) was applied for the annual percent change (APC) for each segment of the trend and the AAPC over the entire study period, with 95% confidence intervals (CIs) of AAMR [19]. This approach attempted to determine significant change in an AAMR configuration by application of log-linear regression in situations of temporal change, and 2-tailed t-testing. The measure of significance difference was a p-value < 0.05.
Results
Baseline characteristics of study population
Over the 21-year study period (1999–2020), a total of 39,793 deaths were attributed to AMI in individuals associated with obesity, corresponding to an AAMR of 0.53 per 100,000 population. Of these deaths, 24,380 (61.2%) were male and 15,413 (38.8%) were female. The AAMR was higher among males, at 0.70 compared to 0.39 among females, highlighting a significant sex disparity in AMI mortality among obese individuals. The South accounted for the largest proportion of deaths (14,150 deaths; 35.6%), followed by the Midwest (10,633; 26.7%), West (8,904; 22.4%), and Northeast (6,106; 15.3%).
The highest AAMR was observed in the Midwest, at 0.65, followed by the South (0.52), West (0.53), and Northeast (0.43). The majority of deaths occurred in Non-Hispanic (NH) White individuals (31,566; 79.3%), with an AAMR of 0.58. NH Black or African Americans accounted for 13.3% (5,326 deaths), with a higher AAMR of 0.68. Other groups included Hispanic White individuals (2,106; 5.3%, AAMR: 0.32), NH American Indian or Alaska Native (304; 0.76%, AAMR: 0.60), and NH Asian or Pacific Islander (340; 0.85%, AAMR: 0.10). The urban-rural breakdown revealed a concentration of deaths in urban areas, particularly Large Central Metropolitan regions (7,953 deaths; 19.9%) and Large Fringe Metropolitan areas (7,604; 19.1%).
However, the highest AAMRs were observed in rural settings, specifically: Micropolitan Non-Core: AAMR 0.89 (95% CI: 0.86–0.91) vs. Metropolitan Non-Metro: AAMR 0.86. In contrast, the lowest AAMRs were found in urbanized areas: Large Central Metro: 0.37 vs. Large Fringe Metro: 0.41.
An analysis of the data in two different periods shows an important trend. In 1999–2009, the APC in mortality essentially remained unchanged at 0.12 (95% CI: –1.10 to 1.34, p = 0.84), resulting in a decade of stability. However, during the 2009–2020 period, mortality began to rise significantly, as evidenced by the APC increasing to 3.26 (95% CI: 2.36 to 4.17, p < 0.001), indicating a rising trend. Overall, the AAPC for the period was 1.75 (95% CI: 1.06 to 2.45, p < 0.001), confirming that mortality rates from AMI associated with obesity increased significantly over the entire 20-year study period (Figure 1, Tables I, II).
Figure 1
Overall and gender-specific mortality trend of acute myocardial infarction associated with obesity
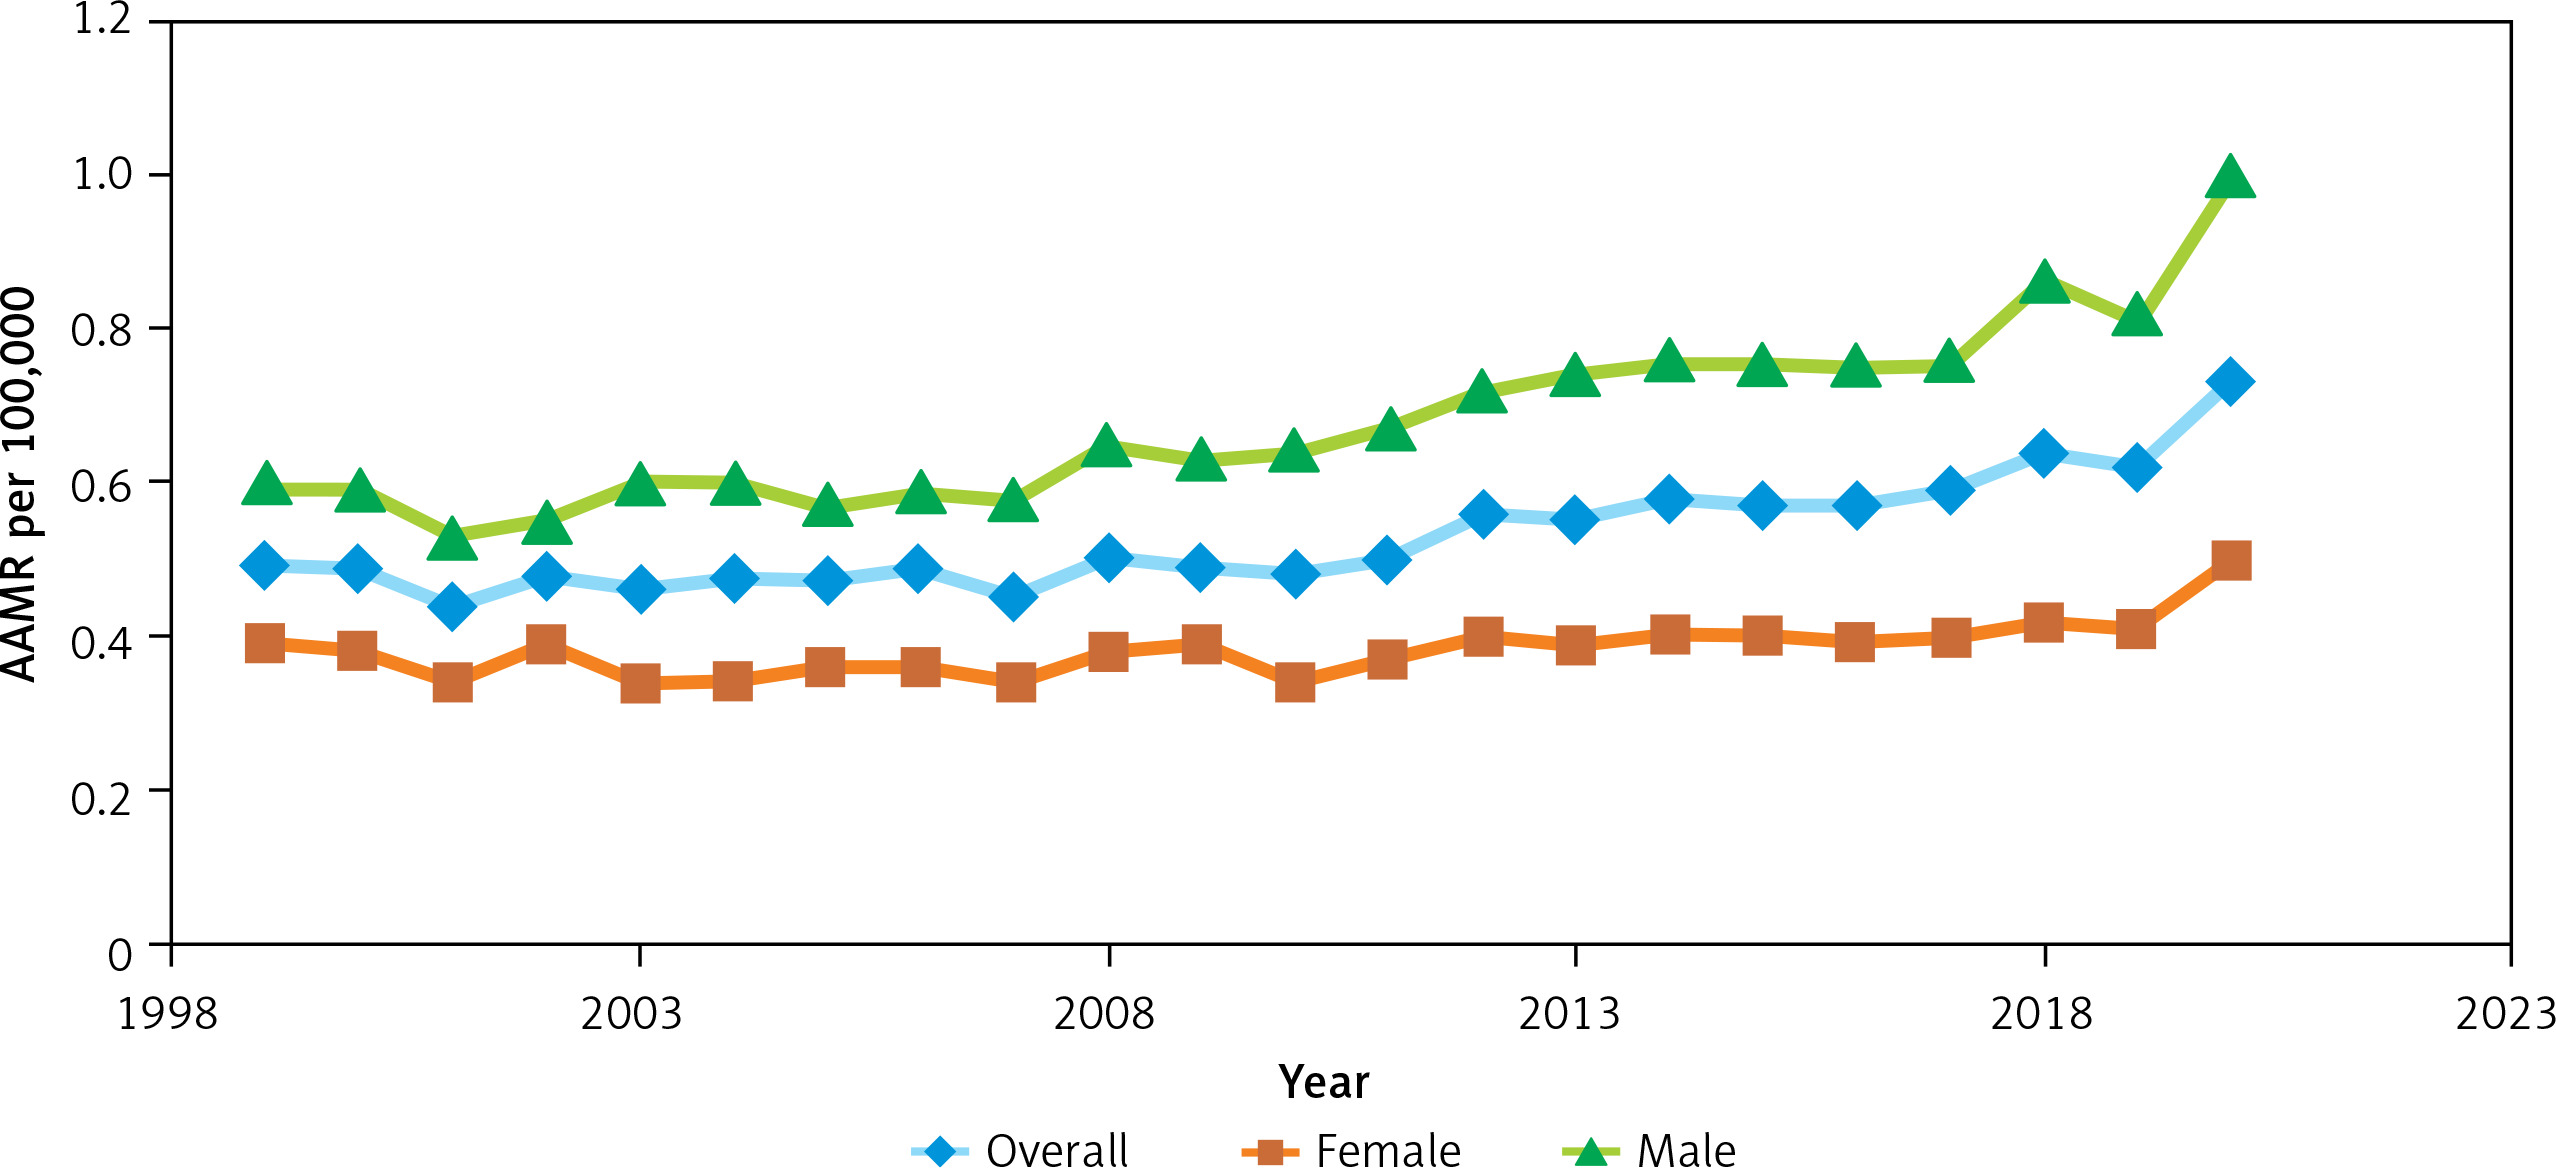
Table I
Demographic variables with total number of deaths and AAMR per 100,000
Table II
Trend segment, annual percentage changes (APC), and average annual percentage change (AAPC) in AMI- and obesity-related mortality in the United States from 1999 to 2020
Stratified by sex
Starting with the sex breakdown, the death certificates showed 24,380 deaths in men and 15,413 in women. The trend for men stood out. Between 1999 and 2017, the APC was 1.95 (95% CI: 1.39 to 2.51, p < 0.001), but then it spiked to 8.10 from 2017 to 2020 (95% CI: 1.75 to 14.82, p = 0.01). Over the full period, the AAPC for men was 2.81 (95% CI: 1.87 to 3.76, p < 0.001). For women, however, the increase was steadier and less intense, with an APC of 1.12 across the whole 21 years (95% CI: 0.70 to 1.55, p < 0.001) (Figure 1, Tables I and II).
Stratified by race
For NH Black or African American individuals, the trend from 1999 to 2018 showed a slight increase but statistically insignificant APC of 0.47 (95% CI: –0.02 to 0.98), with a p-value of 0.06. However, from 2018 to 2020, there was a significant surge to 19.28 (95% CI: 3.93 to 36.91; p = 0.01). The overall AAPC for 1999–2020 was 2.13 (95% CI: 0.82 to 3.46; p = 0.001), indicating a positive trend.
For White individuals, there was a statistically significant APC of 1.02 from 1999 to 2010, followed by a stronger increase of 3.60 from 2010 to 2020 (p < 0.001). The overall AAPC for Whites was 2.24 (p < 0.001). Hispanic White individuals showed a consistent APC of 3.05 over the entire period, which was statistically significant (p < 0.001) (Tables I and II).
Stratified by region
The analysis is split into two segments per region, in addition to a comprehensive evaluation covering the full period of 1999–2020.
In the Northeast Region, the first segment (1999–2001) reveals a notable decline in the rate at –15.14, although there is a wide confidence interval (–31.9285 to 5.7835) and a non-significant p-value (0.134). However, the second segment (2001–2020) shows a positive APC of 1.5921%, which is statistically significant, with a p-value of p < 0.001. Despite this, the overall AAPC for the full range (1999–2020) is slightly negative at –0.1345%, with a p-value of 0.89, indicating that the overall trend is not statistically significant.
In the Midwest Region, the first segment (1999–2005) exhibits a small negative APC of –1.5351%, which is not statistically significant (p = 0.39). However, the second segment (2005–2020) shows a substantial positive APC of 3.3155%, with a highly significant p-value (p < 0.001). The full range AAPC for the Midwest is 1.9057%, with a significant p-value (p < 0.001), indicating an overall positive trend in the indicator measured during this period.
The South Region exhibits a notable upward trend across both segments. The first segment (1999–2017) shows a statistically significant APC of 1.80 (95% CI: ; p < 0.001), while the second segment (2017–2020) reflects an even larger increase, with an APC of 9.49 and a significant p-value (0.006). The AAPC for the entire period (1999–2020) in the South is 2.87 (95% CI), with a highly significant p-value (p < 0.001), indicating a substantial and statistically significant increase in the indicator over the full period.
In the West Region, a consistent positive trend is observed, with an APC of 1.17 from 1999 to 2020. This trend is statistically significant (p < 0.001), with the same APC value for both the segment and full range analyses, suggesting steady growth throughout the period (Tables I and II).
Stratified by metropolitan areas
For the Large Central Metropolitan area, the APC was –3.30 from 1999 to 2004 (95% CI: –7.16 to 0.72; p = 0.099), APC of 1.35 from 2004 to 2018 (95% CI: 0.35 to 2.34; p = 0.011), and 10.56 from 2018 to 2020 (95% CI: –5.57 to 29.45; p = 0.194), with an AAPC of 1.05 (95% CI: –0.68 to 2.82; p = 0.238).
For the Large Fringe Metro area, the APC was 0.29 from 1999 to 2016 (95% CI: –0.68 to 2.82; p = 0.496) and 6.79% from 2016 to 2020 (p = 0.038), with resultant AAPC of 1.50% (p = 0.022), signifying a positive trend. A slightly negative APC of –1.13% from 1999 to 2007 (p = 0.298), then positive 3.24% from 2007 to 2020 (p < 0.001), gives the Medium Metro areas an AAPC of 1.55% (p = 0.001), indicating a positive trend. The Small Metro areas showed a unique, steady APC of 3.24% throughout the entire period (p < 0.001). In like manner, the Micropolitan areas had an invariable APC of 3.11% (p < 0.001). The Noncore areas displayed tremendous growth in both segments, with a solid AAPC of 3.53% (p < 0.001), demonstrating a vigorous positive trend (Tables I and II).
Discussion
Our analysis of AMI and obesity-related deaths showed an increasing trend from 1999 to 2020 in the United States, as indicated by the AAPC of 1.75%. However, a single join point was identified in the data, dividing the trend into two separate phases. The first segment (1999–2009) revealed a statistically insignificant increase in mortality, with an APC of 0.1156%. But a sharp surge in mortality was observed in the second segment (2009–2020), with an APC of 3.2621%. Other studies also observed an increasing trend in AMI-related mortality over the years. Shaukat et al. reported a consistent rise in AAMR from 1999 to 2020, with an AAPC of 5.03 (95% CI: 4.5–5.4) [20]. The observed trend of mortality could be due to the refined diagnostic sensitivity of AMI [21], increased prevalence of obesity, diabetes, and health inequities [22, 23]. A study by Ahmed et al. showed a consistent increase in AAMR from 1999 to 2018 (APC: 4.3, 95% confidence interval (CI): 3.4–4.9), which surged thereafter until 2022 (APC: 11.4; 95% CI: 7.7–19.1) [24]. Differences in the patient population can also explain this trend, because older patients are more likely to present with CAD and AMI than younger people [25].
A similar surge was observed in 2020 in the study by Dimala et al. [26]. This surge can be attributed to the COVID-19 pandemic, which resulted in saturated healthcare facilities and severe complications for individuals with pre-existing conditions such as CAD due to the COVID itself. The patients also feared becoming infected, which led to delayed or missed diagnosis and treatment for acute cardiac events. Cardiovascular health was, in general, worsened during this period by factors such as reduced physical activity, poor dietary habits, and increased stress secondary to lockdowns. Even though the study by Dimala et al. showed a surge in mortality during the COVID-19 pandemic, there was a significant decrease in the age-standardized mortality rates of both CAD (from 249.4 to 118 per 100,000 cases [p < 0.001]) and AMI (from 93.4 to 34.1 per 100,000 cases [p < 0.001]) initially. The declining mortality could be attributed to marked improvement in the prevention and treatment of CAD and AMI [24, 26].
Special attention is needed for the findings within racial, gender, and geographical subgroups, given the pressing inequities among various populations across the U.S. Stratification of data by sex showed different trends for males and females. The mortality rates for females increased steadily throughout the study period. However, for males, mortality rates were elevated in the second segment (2017–2020). A study by Saeed et al. showed higher AAMR in males as compared to females [27]. Another study conducted in China by Zhang et al. described different risk factors and their association with acute myocardial infarction between the two genders [28]. This might be explained by the fact that men, as compared to women, have a higher risk of cardiovascular disease [29, 30].
Studies showed a difference in findings on coronary angiograms between males and females. Women were more likely to have no obstructive disease on the coronary angiogram (43.4% vs. 33.2%, p = 0.03) as compared to men [31, 32]. The different findings on the coronary angiogram and differences in exposure to different risk factors could potentially be the reason for different trends in AMI- and obesity-related mortality in our study, but there is room for additional research to completely understand this process.
The analysis revealed that rural and smaller metropolitan areas had a statistically significant rise in AMI-related mortality over the years, which reflected the healthcare challenges faced by the individuals living in these areas, such as limited healthcare access and less attention to preventive medicine. In these larger metro areas, mortality increases were generally more modest and mostly appeared in the later years of the study. This may be partly explained by the higher disease incidence in urban areas, along with better-developed healthcare infrastructure, which often serves as a referral center for more critically ill patients transferred from surrounding regions [33, 34]. A study by Saeed et al. [27] showed higher AAMR for AMI-related deaths in cancer patients in non-metropolitan areas as compared to metropolitan areas. Lack of healthcare infrastructure, physician availability, access to health insurance, and low socioeconomic status in rural areas might have contributed to increased AMI-related mortality in rural areas [34, 35]. Overall, the consistent upward trend across both metro and non-metro areas highlights the widespread and growing impact of AMI and obesity. The data underscore the urgent need for targeted public health interventions, especially in vulnerable and underserved populations, in order to help reverse these trends and address the growing health disparities across the U.S.
All races demonstrated an increasing trend of mortality throughout the study period. However, Black or African American individuals showed sharp increases in mortality from 2018 to 2020. Similar trends of the highest AAMR were observed in the Black or African American population. A study by Raisi-Estabragh et al. demonstrated the highest AAMR as compared to other races [36]. This might be due to the highest prevalence of obesity among Blacks of all races in the U.S. [37], and obesity is directly correlated with cardiovascular morbidity and mortality. Obesity is considered to be multifactorial; some races have a societal disadvantage over others. Differences in socioeconomic status and access to health insurance have been demonstrated to be strong indicators of CVD mortality among different races [38]. Therefore, it is necessary to understand and address the root causes of disparities among different races to place more focus on the health care needs of the underprivileged population.
AMI-related mortality consistently increased throughout all regions except the Northeast, which demonstrated a slight overall decline in AAMR. Similar regional disparities have been previously reported. A study by Atreya et al. exhibited statistically significant higher in-hospital CVD mortality in all regions of the U.S. including the Midwest (OR = 1.06 [95% CI: 1.03–1.08]), South (OR = 1.11 [95% CI: 1.09–1.13]), and West (OR = 1.16 [95% CI: 1.13–1.18]), as compared to the Northeast [39].
The observed differences in mortality rates may be attributed to disparities in access to healthcare and the quality of healthcare infrastructure across regions. Areas with limited medical resources, fewer healthcare facilities, or reduced availability of specialized care often face delays in diagnosis and treatment, which can negatively impact outcomes. In contrast, regions with well-developed healthcare systems tend to offer timely interventions and better disease management, contributing to lower mortality rates. Addressing these regional inequalities is essential to improving overall health outcomes and ensuring equitable care for all populations.
Our comprehensive analysis of AMI- and obesity-related mortality in the United States from 1999 to 2020 reveals a concerning and consistent upward trend, particularly in recent years. The rise in mortality is multifaceted – driven by increasing prevalence of obesity and comorbidities such as diabetes, disparities in healthcare access and infrastructure, and the far-reaching impact of the COVID-19 pandemic. Demographic differences across sex, race, geography, and the urban-rural divide further underscore the complex and unequal burden of cardiovascular disease. Vulnerable populations – especially females, Black or African American individuals, rural residents, and those of lower socioeconomic status – continue to face disproportionately high mortality risks. These findings call for urgent, data-driven public health interventions that not only prioritize prevention and early detection but also address structural inequities in healthcare delivery. Closing these gaps will be essential to reversing these rising mortality trends and achieving more equitable cardiovascular outcomes for all Americans.
The research employing the CDC WONDER database analysis through Joinpoint software reveals important trends in AMI and obesity-related mortality, but presents several significant limitations. The study depends on death certificate records, which might have classification errors or incomplete reporting, particularly in obesity cases where root causes may lack proper documentation. While the study analyzes deaths where both AMI and obesity were recorded as multiple causes of death, causal attribution cannot be definitively made due to the retrospective, observational nature of the dataset. The dataset does not specify the exact time interval between the AMI event and death, limiting temporal mortality pattern analysis. Additionally, there is no access to key clinical or lifestyle variables such as smoking status, presence of diabetes, hypertension, lipid levels, physical activity, diet, or medication adherence – factors that are known to significantly influence AMI risk and outcomes.
The CDC WONDER database does not provide precise body mass index (BMI) values or stratification by obesity class (Class I, II, III). As BMI stratification was not available in the CDC WONDER dataset, we could not analyze mortality trends across obesity classes (I, II, III), which limits granularity in assessing the relative impact of varying obesity severity on AMI-related mortality.
The data lack direct measures of socioeconomic status or healthcare access, which are important determinants of cardiovascular outcomes. While we used geographic proxies such as urban-rural classification and regional data, these do not fully capture the complex socioeconomic context in which health disparities occur.
The analytic process faces limitations due to the employment of the Joinpoint software for examining trends. Joinpoint excels at identifying trend changes yet operates under the assumption of piecewise linear models, which may fail to analyze nonlinear patterns present in mortality data. The analysis outcomes produced by Joinpoint software fluctuate based on the selected segmentation points because various segment definitions produce different trend interpretations.
In conclusion, although this study highlights significant trends in AMI mortality among the obese population, the lack of detailed clinical, behavioral, and socioeconomic data, as well as the limitations of retrospective death certificate analysis, constrains our ability to draw causal inferences or fully explore subgroup-specific risk profiles. Future studies incorporating richer clinical datasets are warranted to better understand the multifactorial drivers of AMI mortality in obese populations.
The research identified significant patterns in mortality rates for AMI and obesity among different demographic segments within the United States between 1999 and 2020. The age-adjusted mortality rate showed continuous growth throughout the study duration, with more pronounced increases during 2009–2020. Analysis revealed marked disparities between different sexes, races, regions, and metropolitan areas, with males and Black or African American individuals, along with residents of smaller metropolitan or non-metropolitan regions, facing more pronounced increases. The results highlight the necessity of public health strategies specifically aimed at reducing the rising impact of AMI, along with deaths related to obesity, observed in recent years.