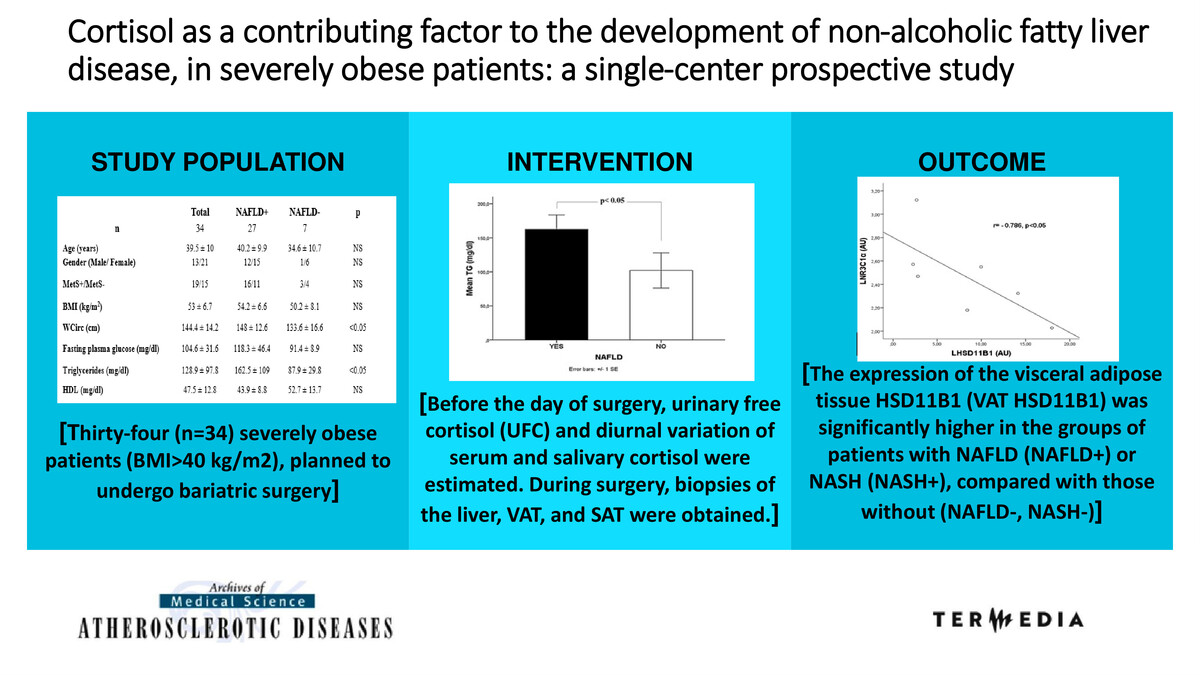
Introduction
Nowadays, non-alcoholic fatty liver disease (NAFLD) is thought to be the most common liver disease in Western countries, given its high estimated prevalence in the general population, ranging from 20% to 30% [1–7]. Additionally, it constitutes possibly the most frequent cause of abnormal liver chemistry, while, according to estimates, in 2030 it will probably be the most frequent indication for liver transplantation [4].
NAFLD is characterized by excessive accumulation of fat in the liver, which cannot be attributed to secondary causes (e.g., medications, viral hepatitis) or consumption of excessive amounts of alcohol. It covers a wide spectrum of liver disease, ranging from steatosis and nonalcoholic fatty liver, where no inflammation is observed, to non-alcoholic steatohepatitis (NASH) and cirrhosis [5, 6]. NAFLD is diagnosed when, in liver biopsies of patients who do not consume alcohol excessively, more than 5% of the hepatocytes have steatosis [5].
NAFLD has been found to have high prevalence among obese patients, reaching in some studies as high as 90% [1, 6, 8–12]. Its interconnection with the metabolic syndrome (MetS) has been well known for years, constituting a wide field of controversies and research regarding their exact relationship and natural history. In recent years, increasing evidence has supported the theory that NAFLD precedes MetS, suggesting that NAFLD can be used as a marker to identify persons who are at risk of developing MetS [13]. Furthermore, MetS and obesity are well-recognized major risk factors for cardiovascular disease [14–16]. Given the alarmingly high prevalence of MetS and obesity in the general population, which are becoming a contemporary epidemic [17, 18], it is obvious that NAFLD constitutes a major public health concern, since it can progress to more serious liver disease (e.g. NASH, cirrhosis, hepatocellular cancer) [3, 19] and predispose to a variety of other diseases (e.g. cardiovascular diseases, chronic kidney disease) [4, 20–30].
In reviewing the literature, we observed that in recent years, growing evidence from different studies supports the relationship between the expression of HSD11B1 and NAFLD. HSD11B1 is the enzyme responsible for the regeneration of cortisol from inactive cortisone, thus enhancing its action at a pre-receptor level in key metabolic tissues such as the liver and adipose tissue [31–34]. According to a study by Paterson et al. [35], transgenic mice, overexpressing HSD11B1 selectively in the liver, finally developed MetS without obesity, which was found to be associated, among other factors, with fatty liver. Moreover, in a study by Candia et al. [36], human 11β-HSD1 expression in VAT was found to be associated with NAFLD. Findings from another study [37] supported that the inhibition of 11β-HSD1 was an effective method to reduce the liver fat content in humans. Nevertheless, the available data remain limited.
In a previous study [38], we observed downregulation of the nuclear receptor subfamily 3, group C, member 1 (glucocorticoid receptors) a (NR3C1a) expression and lower VAT mRNA levels of HSD11B1 in obese patients without MetS in comparison to those with MetS. According to this finding, we assumed that lower selective tissue cortisol production and action could protect these patients from the metabolic consequences of obesity. This was based on data obtained from our previous study and given the known relationship among obesity, MetS, and NAFLD.
The present study aimed to evaluate the prevalence of NAFLD in severely obese patients with or without MetS, and to investigate possible associations of NAFLD with the expression of HSD11B1, NR3C1a, and NR3C1b in the liver, SAT, and VAT.
Material and methods
Patients
Thirty-four severely obese patients (BMI ≥ 40 kg/m2), scheduled to undergo bariatric surgery, were recruited prospectively in the University Hospital of Patras (Greece) and were enrolled in the study. All participants had completed a thorough preoperative work-up at our hospital, which included clinical (including anthropometric measurements), biochemical, and endocrine assessments. An oral glucose tolerance test with 75 g of glucose and measurement of the fasting insulin and C-peptide, baseline adrenocorticotropin (ACTH), thyrotropin (TSH), tri-iodothyronine (T3), thyroxine (T4), and urinary free cortisol (UFC) (24-h urine collection), were performed. Moreover, serum and salivary cortisol levels were measured at scheduled times (0800 h, 1400 h, 1800 h, and 2300 h).
All the patients underwent bariatric surgery. None of these patients were receiving any medication known to interfere with regulation of the HPA axis or HSD11B1, or to cause NAFLD.
Insulin resistance (IR) was evaluated by the homeostatic model assessment (HOMA) using the following equation: fasting insulin (mIU/ml) × fasting plasma glucose (mg/dl)/405. Insulin sensitivity was also assessed by the quantitative insulin sensitivity check index (QUICKI) using the formula: 1/(log (fasting insulin μU/ml) + log (fasting glucose mg/dl)).
Body composition was estimated by bioelectrical impendence (BC-418 Segmental Body Composition Analyzer; Tanita Europe B.V., Amsterdam, The Netherlands).
The protocol of this study was approved by the Ethical Committee of the University Hospital of Patras (Greece), and informed signed consent was obtained by all the individual patients in the study.
Biochemical measurements/hormone assays
Glucose, electrolytes, urea, creatinine, total cholesterol, triglycerides (TG), low-density lipoprotein (LDL), high-density lipoprotein (HDL), and liver chemistry, which included serum transaminases (aspartate aminotransferase, alanine aminotransferase), γ-glutamyl transpeptidase, serum alkaline phosphatase, albumin, and bilirubin, were measured by an enzymatic colorimetric assay using an automated clinical chemistry analyzer. Serum cortisol, ACTH, TSH, T4, T3, insulin, and C-peptide levels were measured by chemiluminescence immunoassays (Modular Analytics E170; Roche Diagnostics).
The intra-assay co-efficient of variation was 1.9–2% for insulin, 1.3–4.6% for C-peptide, 2–2.9% for ACTH, 1.8–8.6% for TSH, 2.5–4.7% for T4 and 3.6–5.3% for T3. Moreover, the intra-assay co-efficient of variation was 1.1–1.3% for serum cortisol. The inter-assay coefficient of variation was 2.5–2.8% for insulin, 1.8–5% for C-peptide, 2.4–5.4% for ACTH, 3.3–8.7% for TSH, 3–6.9% for T4, 4.7–5.4% for T3, and 1.5–1.6% for serum cortisol.
Anthropometric measurements
Waist circumference, height, and body weight of all participants were measured. The height was measured without footwear and to an accuracy of 0.5 cm, whereas the body weight was measured with the patients wearing light clothing and without any footwear, using a SECA scale with 0.1 kg accuracy. The body mass index (BMI) was calculated using the following formula: body weight (kg)/height (m)².
The waist circumference was measured using an inelastic measurement tape midway between the lower pleural edge and the iliac crest in the middle axillary line to the nearest 0.1 cm, following the recommendations of the World Health Organization (WHO) [39].
The arterial blood pressure was measured using a mercury sphygmomanometer, whilst the patient was in a sitting position. Three consecutive measurements were taken, with an interval of 2 min between them.
Fat and liver biopsies
During surgery, biopsies of the VAT and SAT, as well as liver biopsies, were obtained from all patients during the first 30–60 min after the skin incision. The samples were immediately placed in sample containers containing RNAlater RNA Stabilization Reagent (Qiagen) and stored at –80°C until further analysis. Liver biopsies were also placed in additional sample containers containing a tissue fixative solution (formaldehyde) and transferred to the Pathology Laboratory.
RNA extraction, RT and PCR for HSD11B1 and NR3C1a/b
RNA extraction, reverse transcription (RT) and polymerase chain reaction (PCR) for HSD11B1 and NR3C1a/b were performed [38]. The mRNA levels of HSD11B1, NR3C1a, and NR3C1b were expressed in arbitrary units (AU) as an output of the LinReg program.
Statistical analyses
The data were analyzed using IBM SPSS Statistics, version 24. All values were expressed as the mean ± standard deviation (SD), and statistical significance was set at p < 0.05. The normality of the distribution of all variables was examined by one-sample Kolmogorov-Smirnov tests. Mean values were compared among the groups by one-way ANOVA and by the independent-samples t-test or Mann-Whitney U test for variables without a normal distribution. Correlation coefficients (Spearman) were used to quantify associations. The area under the curve (AUC) was calculated for the serum and salivary cortisol profiles over a 24-h period by the trapezoid rule.
Results
Subject characteristics
Table I depicts the baseline biochemical and clinical characteristics of the patients, regarding the presence of NAFLD.
Table I
Baseline characteristics of patients. Data presented as number of cases (n) or as mean ± SD. Mean values were compared among groups by independent-samples Mann-Whitney U test. Statistical significance was set at p < 0.05
[i] NAFLD – non-alcoholic fatty liver disease, MetS – metabolic syndrome as defined by IDF criteria, MetS+ – severely obese patients with MetS, Mets- – severely obese patients without MetS, SBP – systolic blood pressure, BMI – body mass index, WCirc – waist circumference, HDL – high-density lipoprotein, SBP – systolic blood pressure, DBP – diastolic blood pressure, AST – aspartate aminotransferase, ALT – alanine transaminase, GGT – gamma-glutamyl transferase, TSH – thyroid stimulating hormone, QUICKI – quantitative insulin sensitivity check index, HOMA-IR – homeostatic model assessment-insulin resistance, NS – non-significant.
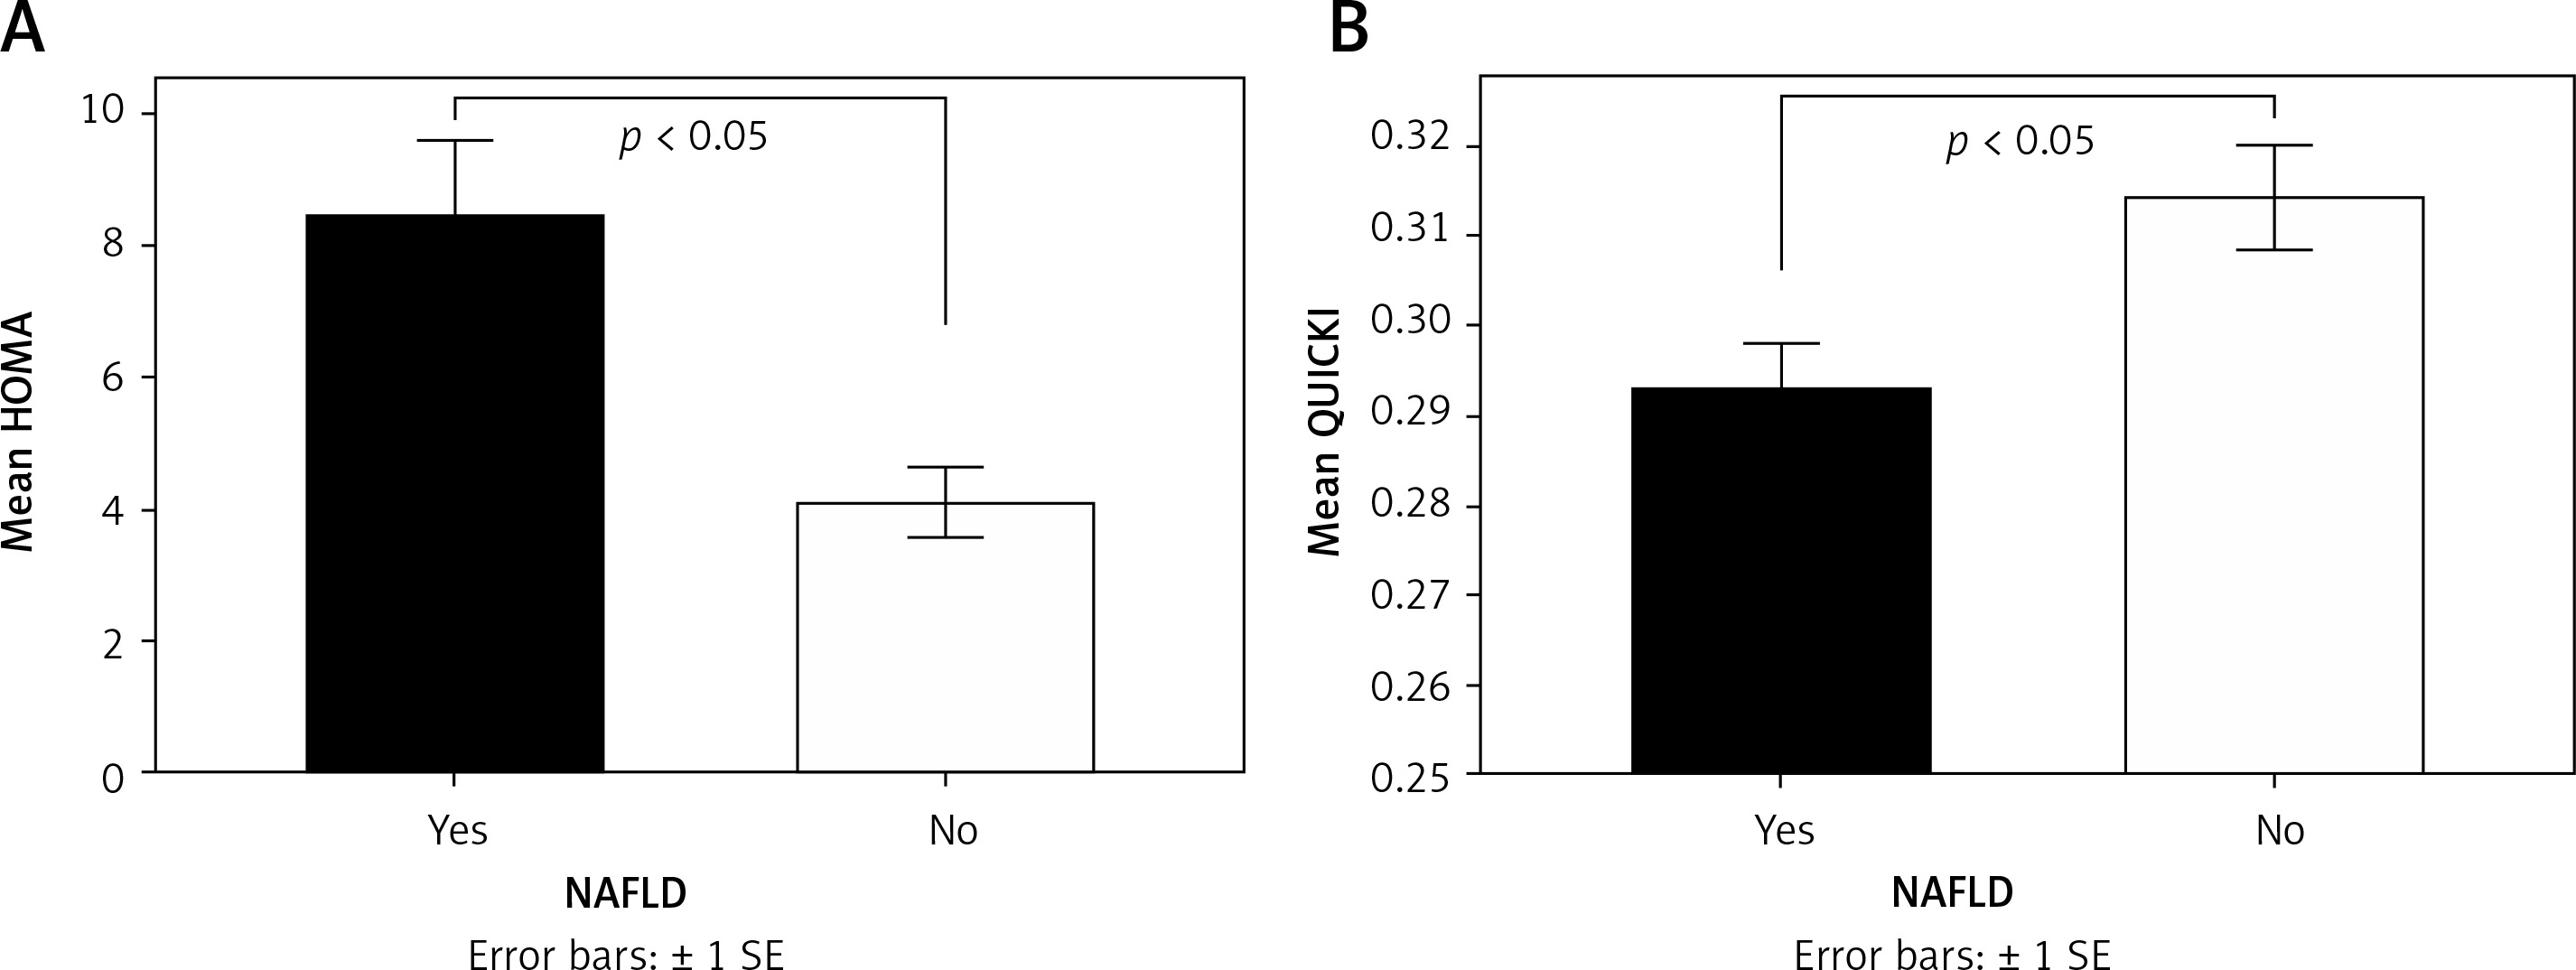
NAFLD was detected in 79.4% of the subjects, whereas NASH was detected in 50%. Triglyceride (Figure 1), waist circumference, insulin, and C-peptide levels (Figure 2) were significantly higher in the group of patients with NAFLD (NAFLD+) compared with the group of patients without NAFLD (NAFLD-) (p < 0.05). Additionally, the quantitative insulin sensitivity check index (QUICKI) was significantly lower in the NAFLD+ group compared with the NAFLD- group (p < 0.05), whilst the homeostatic model assessment-insulin resistance mean value was higher in the NAFLD+ group compared with the NAFLD- group (p < 0.05) (Figure 3).
Figure 1
Mean triglyceride (TG) levels according to the presence of non-alcoholic fatty liver disease (NAFLD). Mean values were compared among groups by independent-samples Mann-Whitney U test. Statistical significance was set at p < 0.05
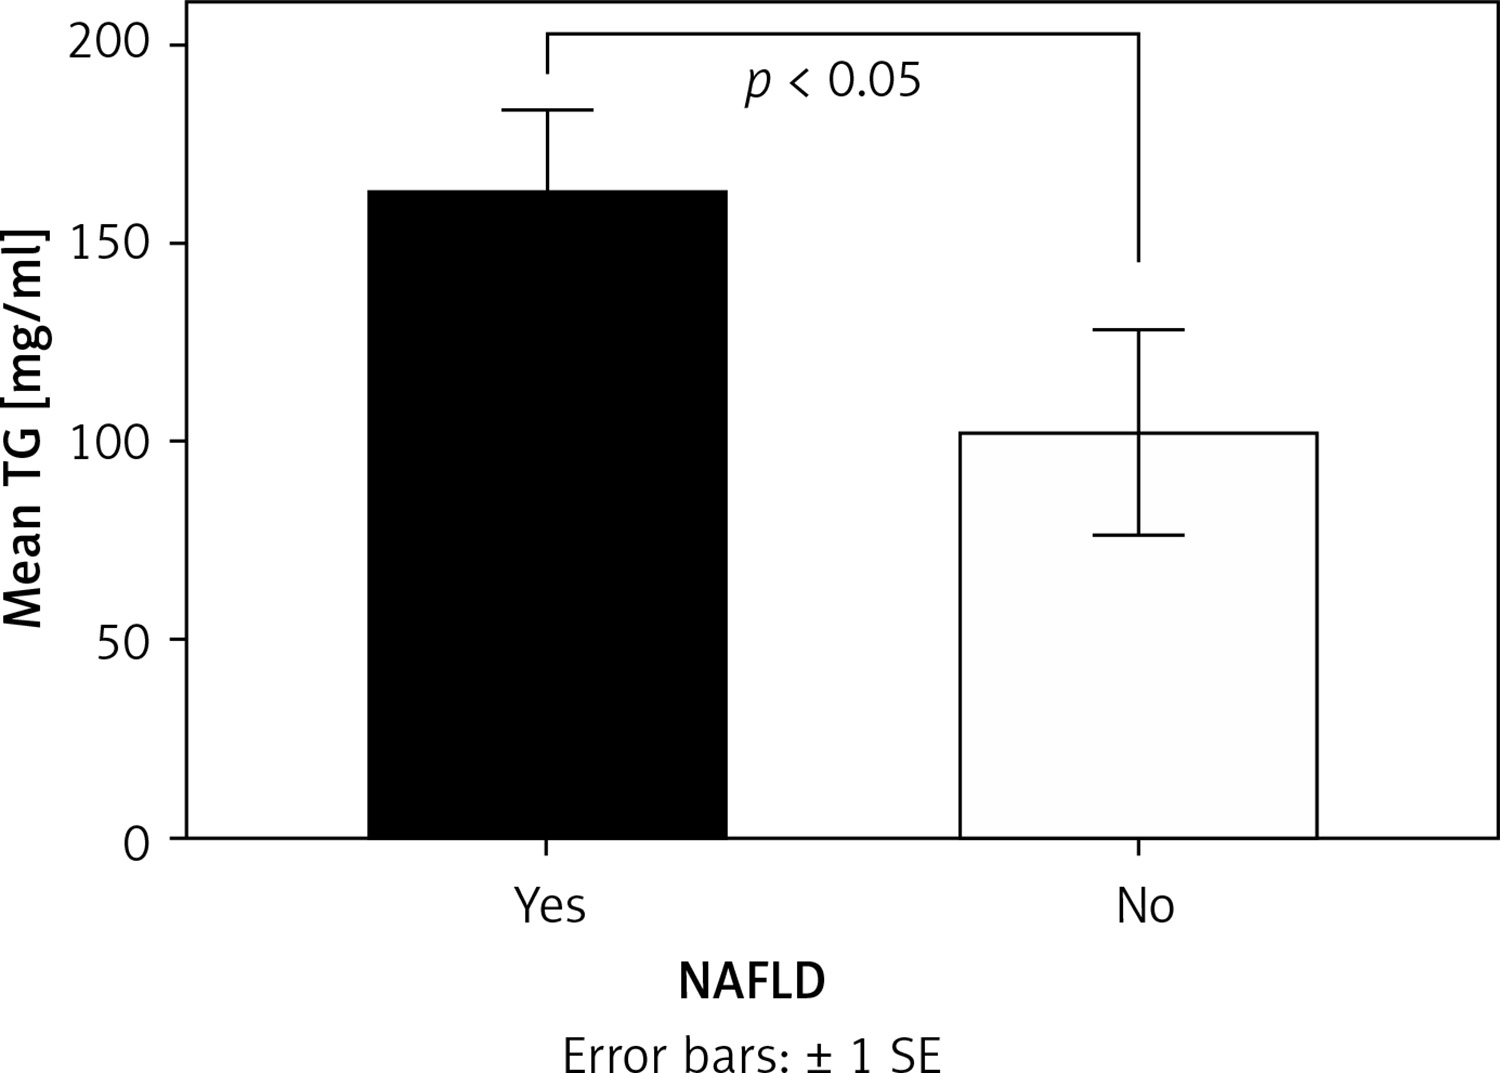
Figure 2
Mean insulin (A) and C-peptide (B) levels according to the presence of NAFLD. Mean values were compared among groups by independent-samples Mann-Whitney U test. Statistical significance was set at p < 0.05
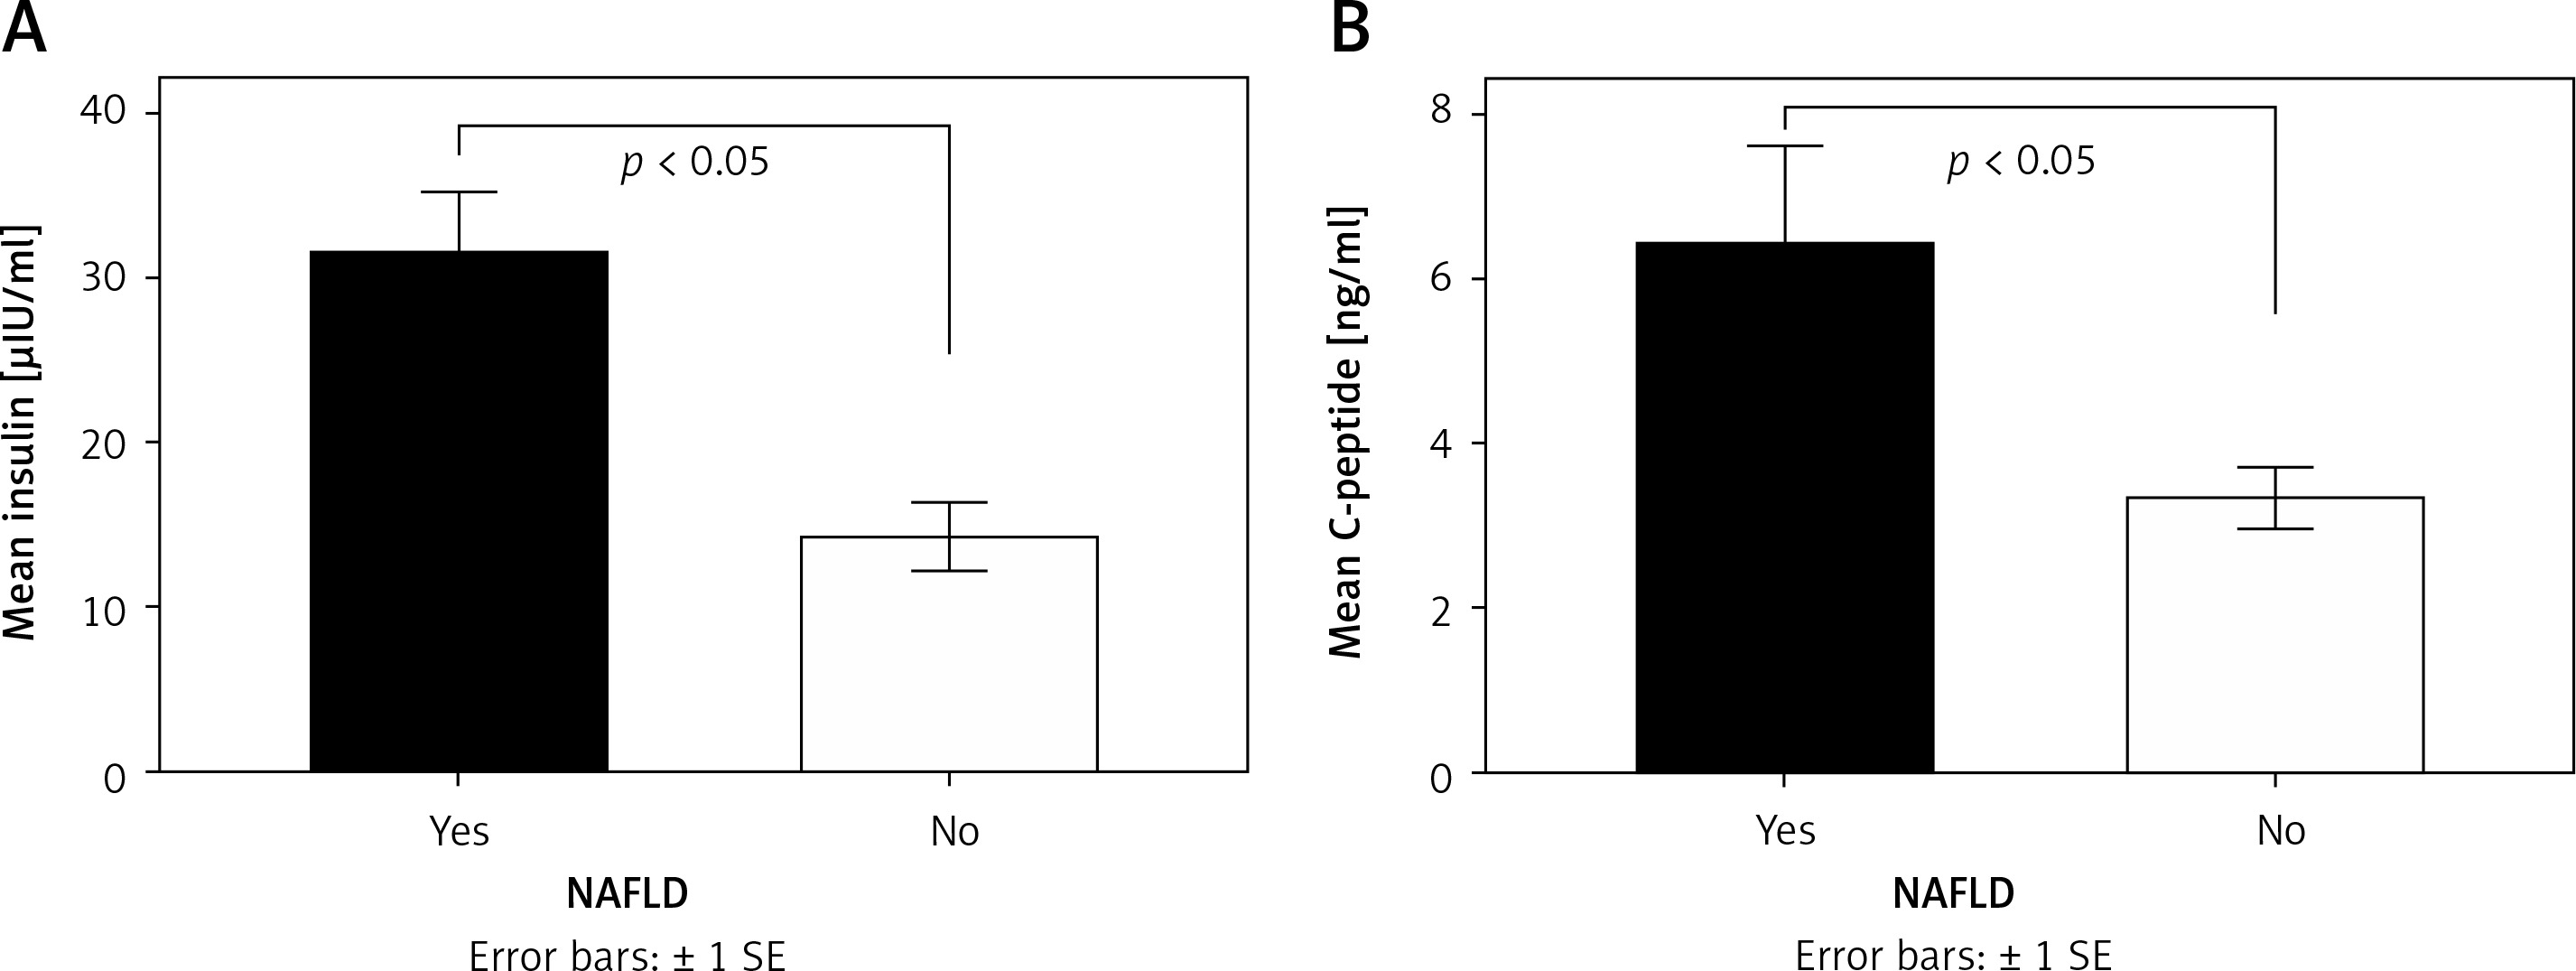
Figure 3
Mean value of Homeostatic model assessment (HOMA) (A) and Quantitative Insulin Sensitivity Check Index (QUICKI) (B) according to the presence of NAFLD. Mean values were compared among groups by independent-samples Mann-Whitney U test. Statistical significance was set at p < 0.05
Very similar results were obtained when examining the above parameters (Tg, insulin, C-peptide, QUICKI, HOMA) according to the presence of NASH. In more detail, triglyceride (Mann-Whitney U test; NASH+ 195.12 ±122.72 mg/dl, NASH- 105 ±54.51 mg/dl; p < 0.05), insulin (Mann-Whitney U test; NASH+ 37.62 ±21.05 μIU/ml, NASH- 18.35 ± 10.34 μIU/ml; p < 0.05), and C-peptide (Mann-Whitney U test; NASH+ 7.79 ±7.42 pg/ml, NASH- 3.81 ±1.4 pg/ml; p < 0.05) levels were significantly higher in the group of patients with NASH (NASH+) compared with those without it (NASH-). The quantitative insulin sensitivity check index (QUICKI) was significantly lower in the NASH+ group compared with the NASH- group (NASH+ 0.283 ±0.022, NASH- 0.312 ±0.022; p < 0.05), whilst the homeostatic model assessment-insulin resistance mean value was higher in the NASH+ group compared with the NASH- group (NASH+ 10.3 ±6.21, NASH- 4.83 ±3; p < 0.05).
NAFLD, NASH, and HPA axis parameters
The area under the curve values for serum (AUCSCORT, NASH+ 177.54 ±63.13 μg/ml h, NASH- 136.9 ±44.54 μg/ml h; p < 0.05) and salivary cortisol (AUCSLVCORT, NASH+ 9.42 ±4.27 μg/ml h, NASH- 6.43 ±2.83 μg/ml h; p < 0.05) were significantly higher in the NASH+ group compared with NASH- group.
No significant differences related to HPA axis parameters were found between NAFLD+ and NAFLD- groups (Table II).
Table II
HPA axis parameters according to the presence of NAFLD. Data presented as number of cases (n) or as mean ± SD
Gene expression
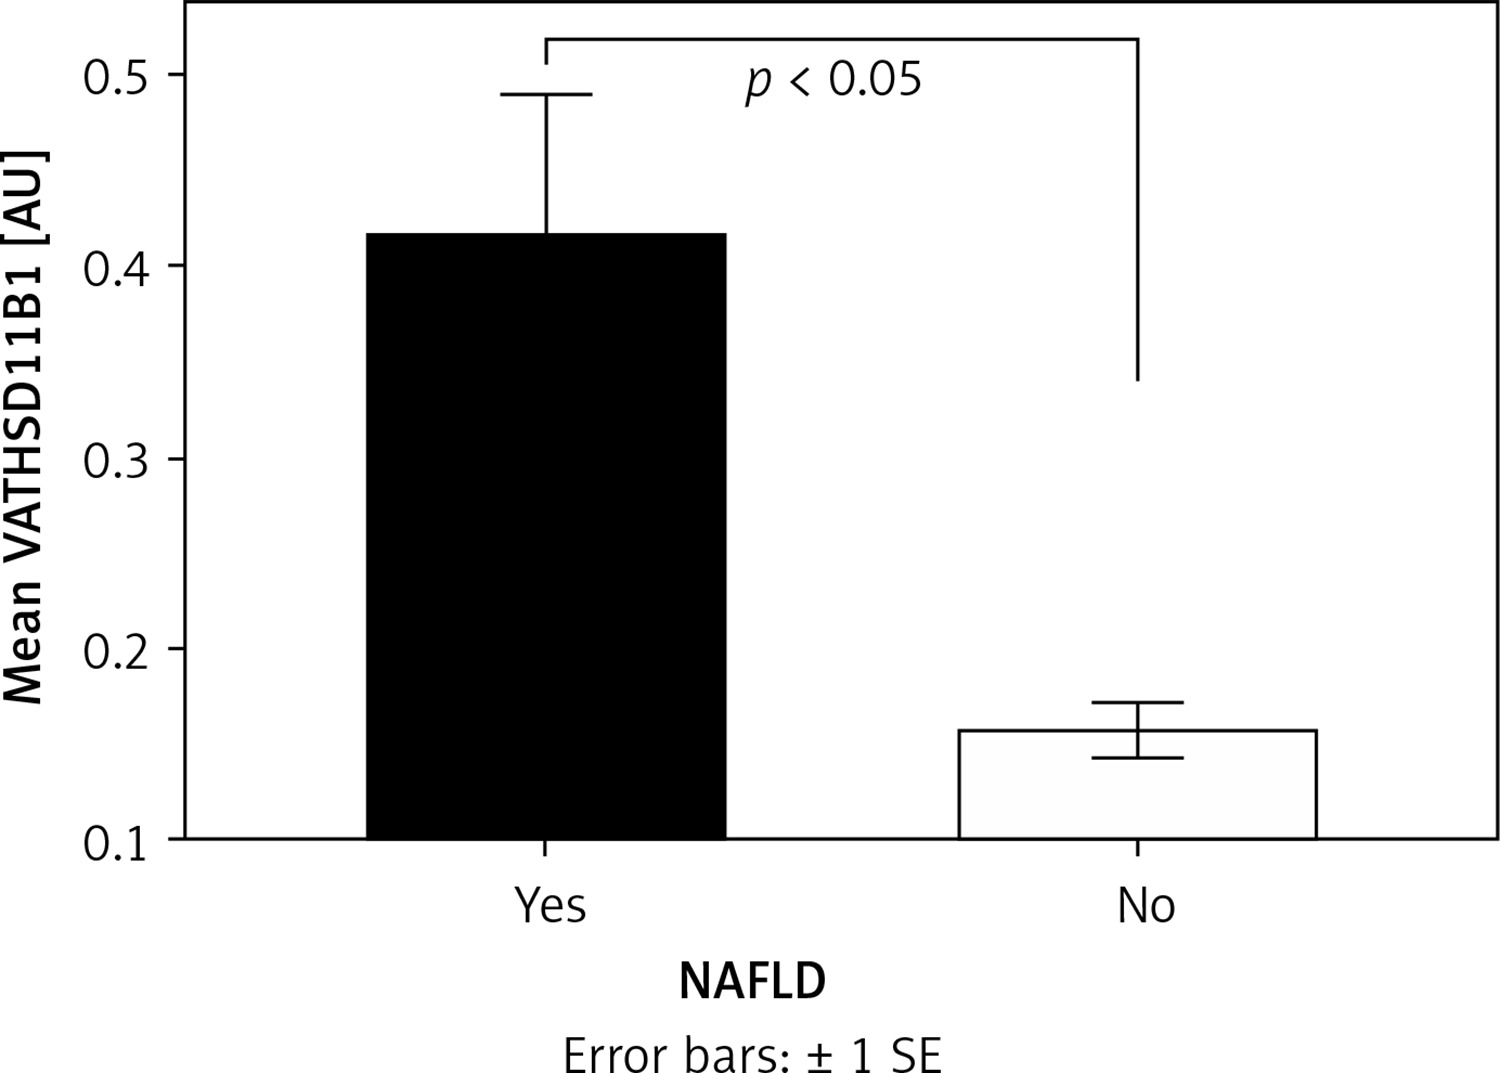
The expression of the visceral adipose tissue HSD11B1 (VAT HSD11B1) was significantly higher in the NAFLD+ group compared with the NAFLD- group (Mann-Whitney U test; NAFLD+ 0.417 ±0.379 AU, NAFLD- 0.157 ±0.039 AU; p < 0.05) (Figure 4), whereas in the SAT (Mann-Whitney U test; NAFLD+ 0.333 ±0.243 AU, NAFLD- 0.256 ±0.151 AU; NS) and liver (Mann-Whitney U test; NAFLD+ 6.301 ±4.332 AU, NAFLD- 8.321 ±6.176 AU; NS) there was no significant difference between groups.
Figure 4
Mean expression of visceral adipose tissue (VAT) hydroxysteroid (11-beta) dehydrogenase (HSD11B1) according to the presence of NAFLD. Mean values were compared among groups by independent-samples Mann-Whitney U test. Statistical significance was set at p < 0.05
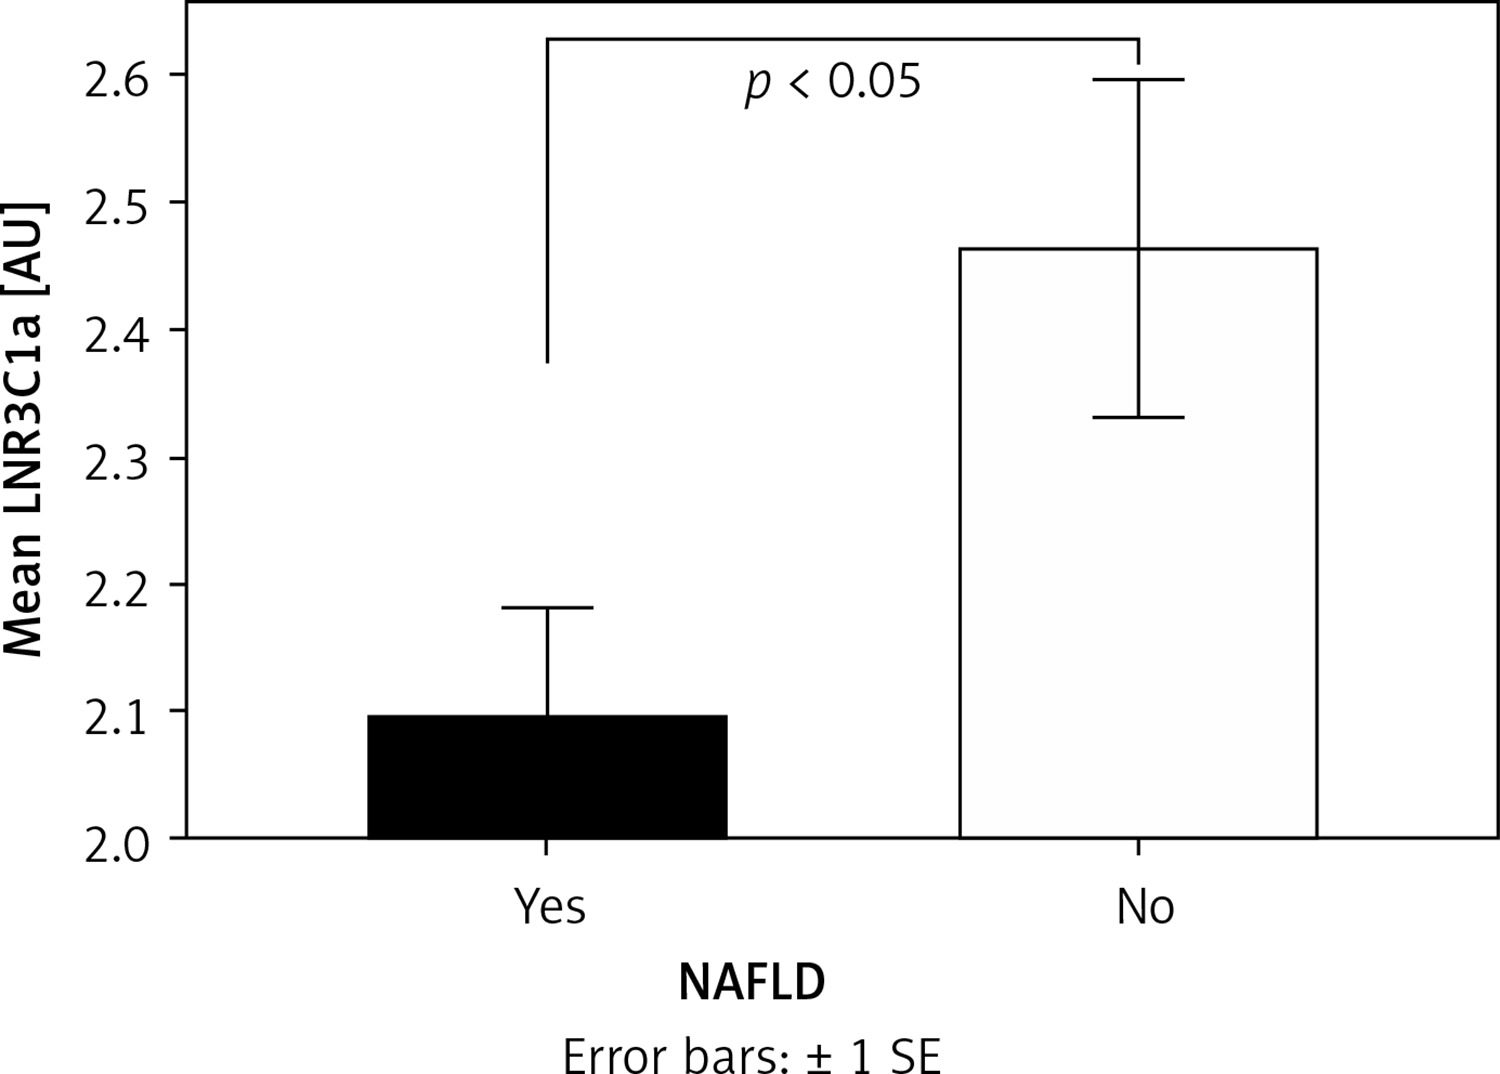
The expression of NR3C1a in the liver (LNR3C1a) was significantly lower in the NAFLD+ group compared with the NAFLD- group (Mann-Whitney U test; -NAFLD+ 2.094 ±0.452 AU, NAFLD- 2.463 ±0.352 AU; p < 0.05) (Figure 5), whereas in the SAT (Mann-Whitney U test; NAFLD+ 0.333 ±0.243 AU, NAFLD- 0.256 ±0.151 AU; NS) and VAT (Mann-Whitney U test; NAFLD+ 6.301 ±4.332 AU, NAFLD- 8.321 ±6.176 AU; NS) there was no difference between groups.
Figure 5
Mean expression of liver NR3C1a according to the presence of NAFLD. Mean values were compared among groups by independent-samples Mann-Whitney U test. Statistical significance was set at p < 0.05
The expression of NR3C1b was not detected either in the visceral, SAT, or hepatic tissue in all participants.
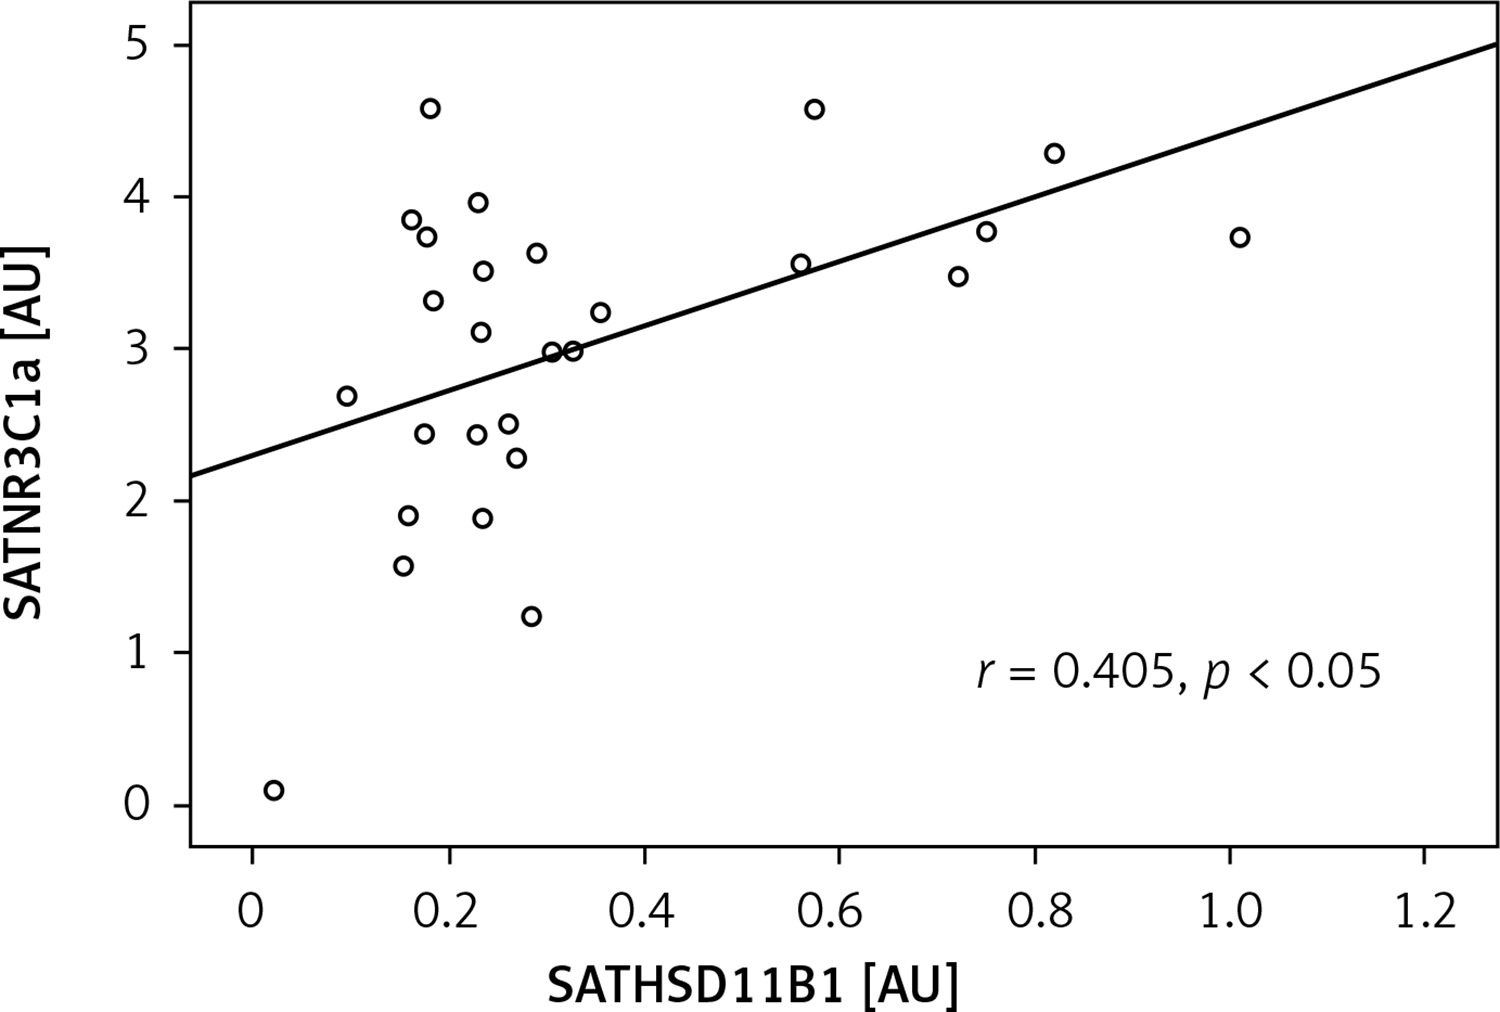
In the NAFLD- group, the expression of HSD11B1 in the liver (LHSD11B1) exhibited a negative correlation with the liver NR3C1a (LNR3C1a) (r = –0.786, p < 0.05) (Figure 6), whereas no association was found in the NAFLD+ group. In the SAT and VAT, no association between HSD11B1 and NR3C1a was detected. Moreover, in the NAFLD+ group, the mRNA levels of HSD11B1 in SAT (SATHSD11B1) were positively correlated with NR3C1a (SATNR3C1a) expression (r = 0.405, p < 0.05) (Figure 7).
Figure 6
Correlation of liver nuclear receptor subfamily 3, group C, member 1 (glucocorticoid receptor) a (LNR3C1a) with liver hydroxysteroid (11-beta) dehydrogenase 1 (LHSD11B1) in NAFLD- group. Bivariate correlation was established by the Spearman’s r-test. Statistical significance was set at p < 0.05
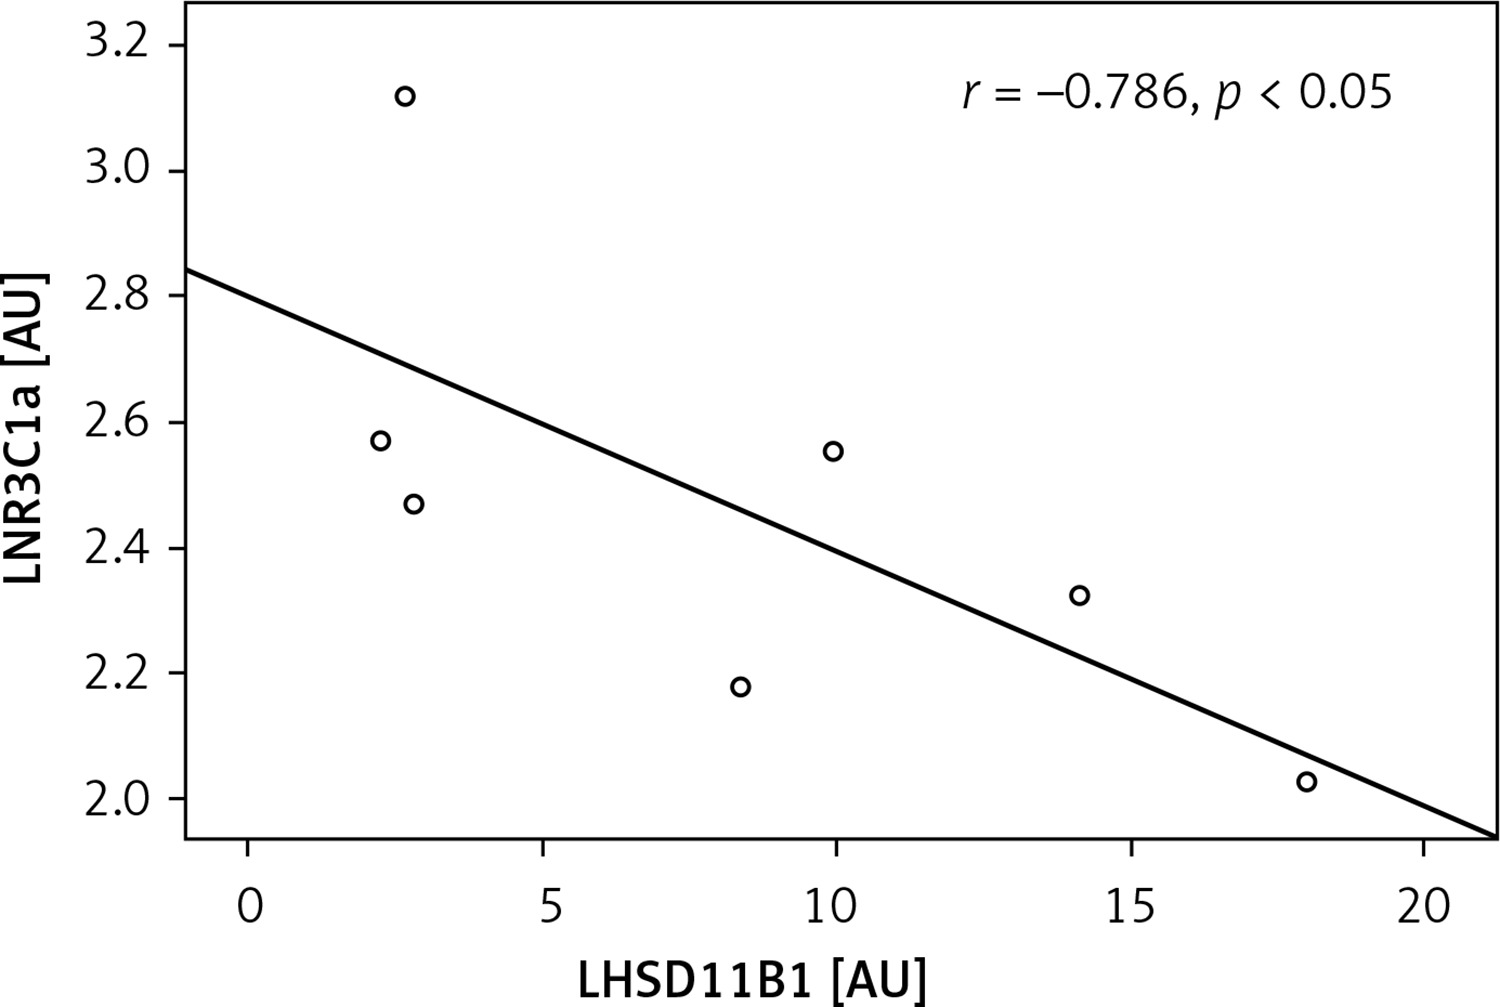
Figure 7
Correlation of subcutaneous adipose tissue nuclear receptor subfamily 3, group C, member 1 (glucocorticoid receptor) a (SATNR3C1a) with subcutaneous adipose tissue hydroxysteroid (11-beta) dehydrogenase 1 (SATHSD11B1) in NAFLD- group. Bivariate correlation was established by the Spearman’s r-test. Statistical significance was set at p < 0.05
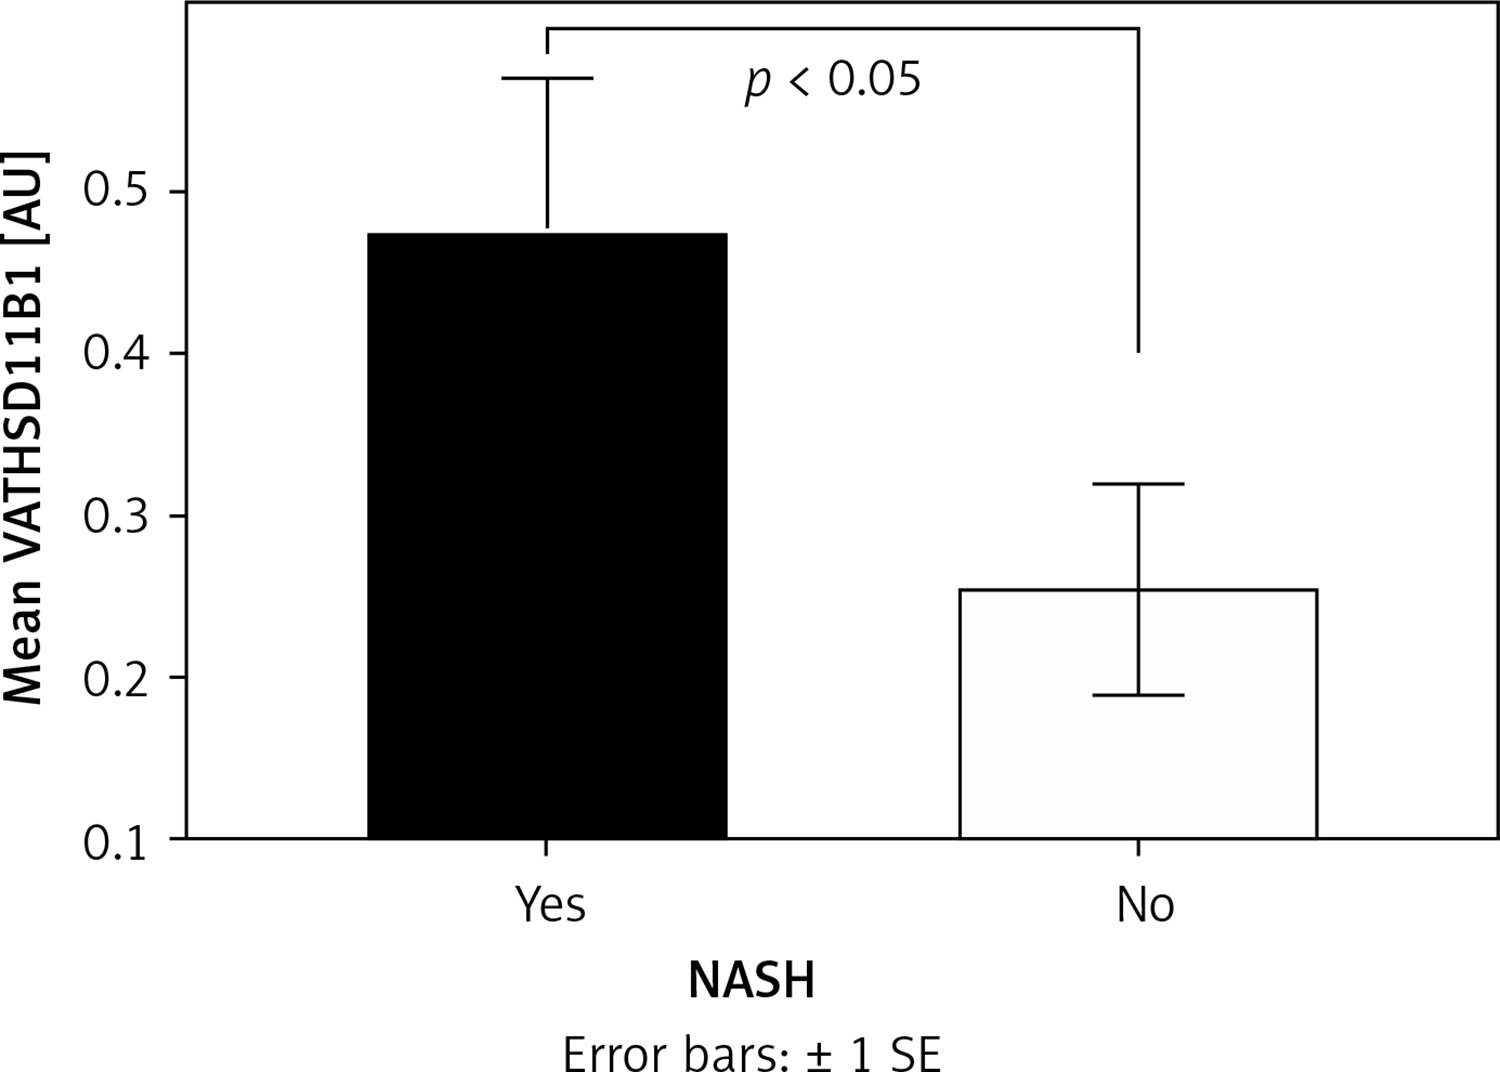
In patients with NASH (NASH+), the expression of VATHSD11B1 was significantly higher compared with the NASH- group (Mann-Whitney U test; NASH+ 0.473 ±0.399 AU, NASH- 0.254 ±0.27 AU; p < 0.05) (Figure 8), whereas in the SAT (Mann-Whitney U test; NASH+ 0.343 ±0.224 AU, NASH- 0.292 ±0.235 AU; NS) and liver (Mann-Whitney U test; NASH+ 6.41 ±4.764 AU, NASH- 7.024 ±4.83 AU; NS) there was no significant difference between groups.
Liver chemistry
The mean levels of alanine transaminase (ALT, Mann-Whitney U test; NAFLD+ 77.8 ±174.4 U/l, NAFLD- 23.7 ±5.7 U/l; p < 0.05) and γ-glutamyl transferase (GGT, Mann-Whitney U test; NAFLD+ 37.9 ±27.7 U/l, NAFLD- 19.5 ±6.1 U/l; p < 0.05) were significantly higher in the NAFLD+ group compared with the NAFLD- group. The mean levels of aspartate aminotransferase (AST) were not significantly different between groups.
Discussion
In the present study, we investigated the presence of NAFLD in severely obese patients with or without the metabolic syndrome. Furthermore, we evaluated the expression of the enzyme HSD11B1, NR3C1a and NR3C1b in the liver, VAT and SAT, as well as the activity of the HPA axis in these patients according to NAFLD presence.
NASH was detected in 50% of the subjects, whereas NAFLD was detected in 79.4%, prevalence rates that are very similar to those reported in previous studies [1, 6, 8–12]. Mean levels of ALT and GGT were significantly higher in the NAFLD+ group compared with those in the NAFLD- group. This finding is consistent with previous studies [5], but it is at odds with reports from other studies [40–42] in which ALT values were not correlated with the histological diagnosis of NAFLD. Physicians usually rely on elevated levels of these liver enzymes to suspect NAFLD, even though nearly 80% of the patients with diagnosed NAFLD have levels of ALT within the normal range [5, 42]. Importantly, Xia et al. [43] observed that the frequency of metabolic syndrome significantly increases with quintiles of ALT and GGT, even within the normal range of these enzymes. Furthermore, in the same study [43] it was reported that these enzymes are important predictors for the development of MetS, with slight elevation of these enzymes within the normal limits, indicating the presence of both metabolic syndrome and NAFLD.
The expression of HSD11B1 in VAT (VAT HSD11B1) was significantly higher in the NAFLD+ group and the NASH+ group compared with the NAFLD- and NASH- group, respectively. This finding is consistent with a recent study from Candia et al. [36], in which the expression of VAT HSD11B1 was positively associated with NAFLD. Notably, in a previous study [38], we found that VAT HSD11B1 was also significantly higher in the group of severely obese patients with the metabolic syndrome, suggesting a likely common pathophysiological pathway for these two pathological entities. In line with these findings, Masuzaki et al. [44] reported that overexpression of HSD11B1 in transgenic mice selectively in the adipose tissue resulted in visceral obesity, hyperlipidemia, hypertension, and diabetes with pronounced insulin resistance, all well-known components of MetS. In these transgenic mice, the portal concentration of cortisol was markedly increased, as expected, since increased expression of HSD11B1 in the visceral adipose tissue can potentially lead to overproduction of cortisol within the VAT. This increased cortisol level in the visceral adipose tissue probably led to the observed increased levels of free fatty acid (FFA) locally and subsequently in the portal vein, consistent with the known lipolytic effects of glucocorticoids [45, 46]. Via the portal circulation the increased FFA and cortisol reach the liver, where the glucocorticoids can promote steatosis by directly stimulating both hepatic de novo lipogenesis and FFA utilization [47]. Furthermore, as has been demonstrated in other studies [48, 49], FFA can contribute to hepatic IR, and to systematic IR as well. Accordingly, in the present study, the homeostatic model assessment-insulin resistance (HOMA-IR) mean value was significantly higher in the group of patients with NAFLD compared to the group of patients without NAFLD, whilst the quantitative insulin sensitivity check index (QUICKI) was significantly lower in the NAFLD+ group compared with the NAFLD- group.
In the present study, we found that the expression of NR3C1a in the liver (LNR3C1a) was significantly lower in the NAFLD+ group compared with the NAFLD- group. Furthermore, in the NAFLD group, the expression of HSD11B1 in the liver (LHSD11B1) exhibited a negative correlation with the liver NR3C1a (LNR3C1a). This finding was similar to our observations in a previous study [38, 50–52], in which the same association was found in severely obese patients without MetS, thus strengthening the association between NAFLD and MetS. Both findings could represent protective mechanisms, either limiting the progression of established NAFLD or preventing initial development of the disease in severely obese patients, since the glucocorticoids exert their intracellular actions and subsequently, and most importantly, their metabolic consequences by binding to this receptor. No similar findings in the NASH+ and NASH- groups were observed, suggesting that disruption of these possible compensatory mechanisms may contribute to the evolutionary pathway from NAFLD to NASH.
In conclusion, in the present study, we highlighted similarities between MetS and NAFLD concerning possible common pathophysiological mechanisms, with tissue cortisol level being a main contributing factor to the development of both. Additionally, we have proposed plausible protective mechanisms against the progression of NAFLD or its evolution into NASH. On the other hand, we failed to provide additional evidence to resolve the ongoing scientific debate over the precise natural history linking MetS and NAFLD. Certainly, based on the findings of the present study, it is obvious that in order to clarify which of these two pathological entities precedes the other, further studies are needed targeting, among other factors, cortisol action and production at the tissue level. The small number of participants is the major limitation of this study.