
Introduction
In the United States (US), cardiovascular disease (CVD) remains the leading cause of mortality and morbidity, accounting for one in every four deaths [1]. Among CVDs, acute myocardial infarction (AMI) is a major cause of death, affecting nearly 3 million Americans each year and resulting in over a million deaths. Over the past few decades, significant advancements in AMI care have emerged from more timely percutaneous coronary interventions, novel thrombotic and antiplatelet therapies and improved risk factor management, all of which have contributed to reduced AMI-related mortality [2, 3]. Despite these advancements, significant disparities still exist between various regional and demographic groups [4]. This, coupled with the aging population and the likelihood of increased future AMI events, highlights the importance of continuing to analyze mortality trends associated with AMI. Our study analysis will enable global physicians to observe how the trends in mortality rates have shifted over the years and enable physicians to further investigate and analyze the effects of updated guidelines and treatments and help to focus future priorities and guide public health strategies. Hence, in this study we utilized a nationwide database to examine overall AMI-related mortality rates between 1999 and 2020, further stratifying the analyses based on demographics and geographical variations to identify gaps in healthcare. By observing variation in mortalities across different strata such as age groups, racial groups and regional distribution, we aimed to identify deficiencies in healthcare to further improve medical care across the US, and we also suggest possible causes for the observed variations based on current literature.
Material and methods
Study setting and data source
The International Statistical Classification of Diseases and Related Health Problems-10th Revision (ICD-10) code (I21) from the CDC WONDER (Centers for Disease Control and Prevention Wide-Ranging Online Data for Epidemiologic Research) database was used to code the death certificate data used in this study. Subsequently, the data were analyzed to determine the mortality rate associated with AMI in adults above 15 over a time period of 2 decades between 1999 and 2020 to provide a perspective of progress over time. This dataset, which includes the cause of death from death records for all 50 states plus the District of Columbia, has been used in numerous studies to find patterns in the deaths linked to cardiovascular diseases. The Underlying Cause-of-Death Public Use record death certificates were analyzed in order to identify AMI-related deaths, which are defined as those in which AMI is mentioned anywhere on the death certificate as either a contributing factor or an underlying cause of death. Since this study used deidentified public use data from the government and adhered to STROBE (Strengthening the Reporting of Observational Studies in Epidemiology) reporting guidelines, it was exempt from the requirement of approval by the local institutional review board.
Data extraction
Population number, year, site of death, demographics, region, states, and urban/rural classification were all recorded. Based on data gathered from death certificates, this information has been incorporated in earlier WONDER database analyses [5].
The demographics included sex, age, and race or ethnicity; the places of death included homes, hospices, nursing homes, and medical facilities (inpatient, outpatient, emergency room, or status unknown), as well as nursing homes and long-term care facilities. The categories for race and ethnicity were: non-Hispanic (NH) Asian or Pacific Islander; NH White; NH Black or African American; NH American Indian or Alaskan Native; and Hispanic or Latino. The death certificates provided the information used in this content. The National Center for Health Statistics classified the population by county into three categories: urban (large metropolitan area [population > 1 million], medium/small metropolitan area [population 50,000–999,999], and rural (population < 50,000) based on the 2013 U.S. census classification [6]. The Midwest, Northeast, West, and South were created by the U.S. Census Bureau’s regional classifications [7].
Statistical analysis
We computed the crude and age-adjusted mortality rates (AAMRs) per 100,000 individuals by gender, state, year, race/ethnicity, and urban-rural status from 1999 to 2020 in order to analyze national trends in AMI-related mortality. Additionally, we provided 95% confidence intervals for every computation. The total number of AMI-related deaths for that year was divided by the corresponding American population to determine the crude mortality rates. By standardizing AMI-related mortality to the US population in 2000, the AAMRs could be obtained [7]. The annual percent change (APC) with 95% confidence interval in AAMR was determined using the Joinpoint Regression Program (Joinpoint V 5.0.2, National Cancer Institute) in order to evaluate national annual trends in AMI-related mortality [8, 9]. In order to find meaningful variations in AAMR over time, temporal fluctuation is fitted with log-linear regression models using this method to create a line of best fit across the years. Using the 2-tailed t-test, APCs were categorized as rising or decreasing based on whether the slope showing the variation in mortality was significantly different from zero. A p-value of less than 0.05 was considered statistically significant, and therefore, trends meeting this threshold were included in our results. Trends with p-values greater than or equal to 0.05 were deemed insignificant and were not reported as they were considered irrelevant.
Results
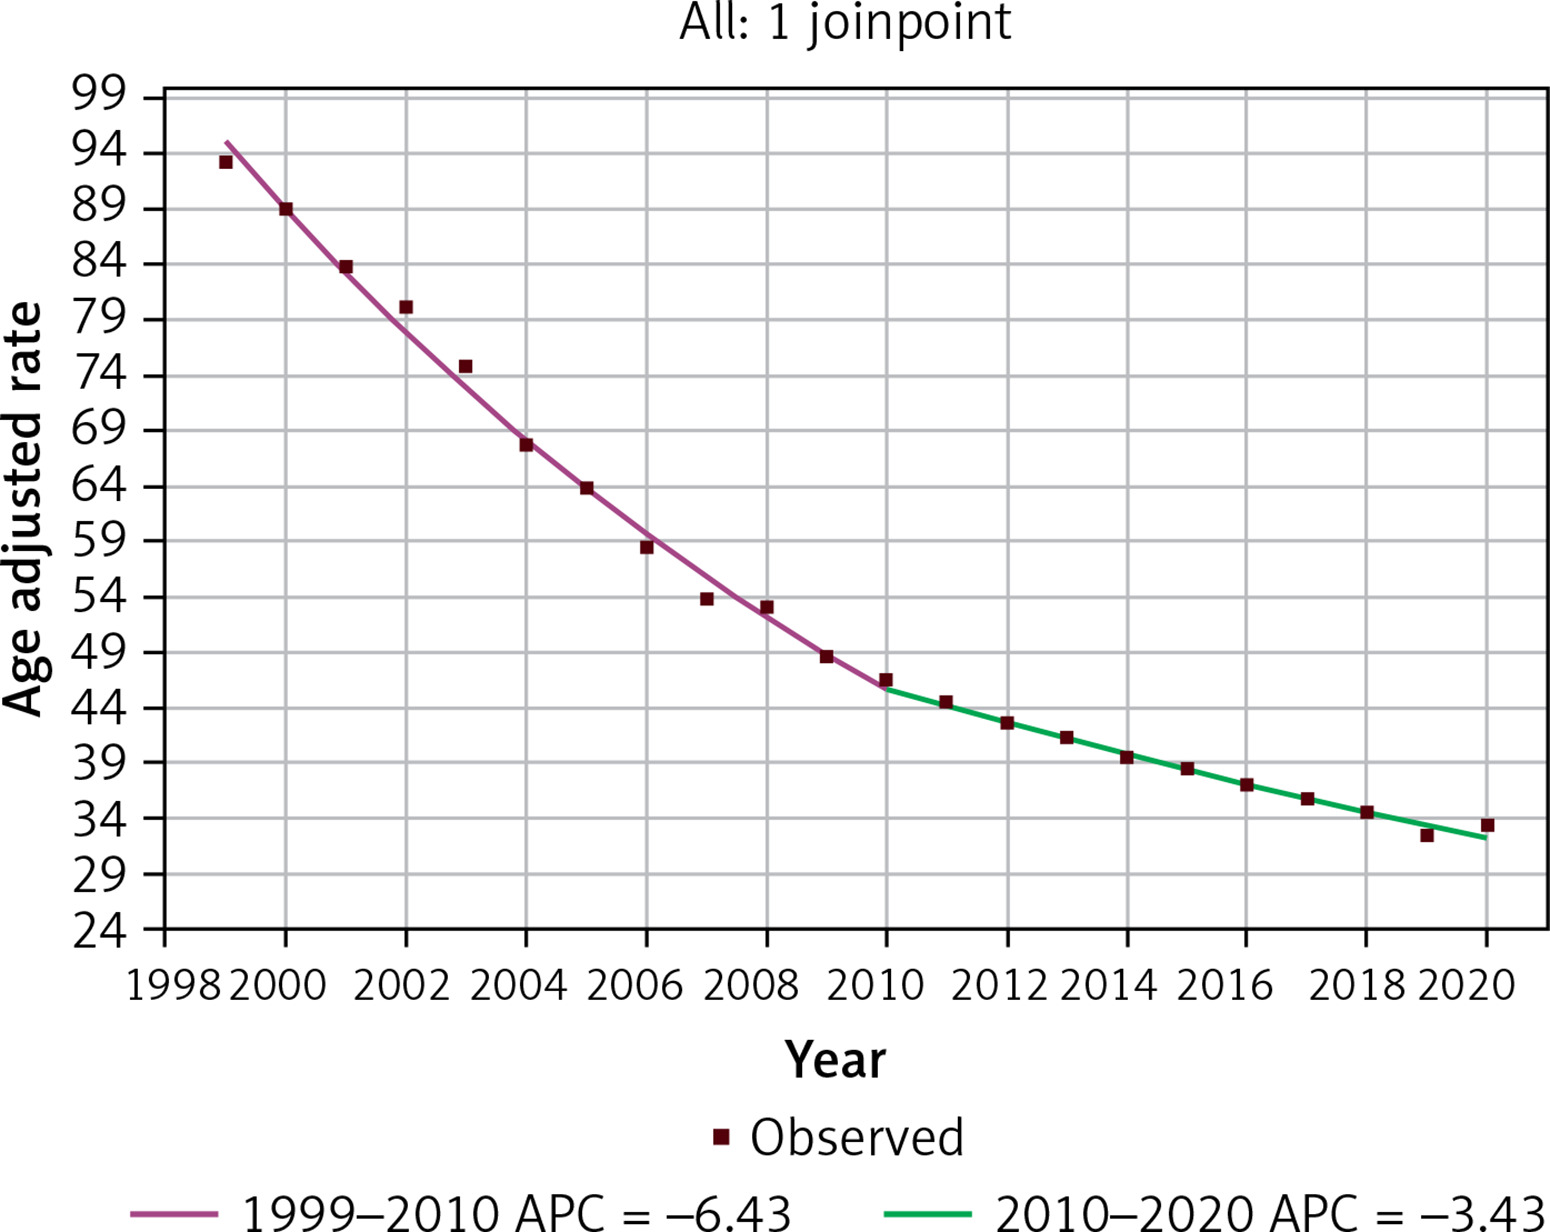
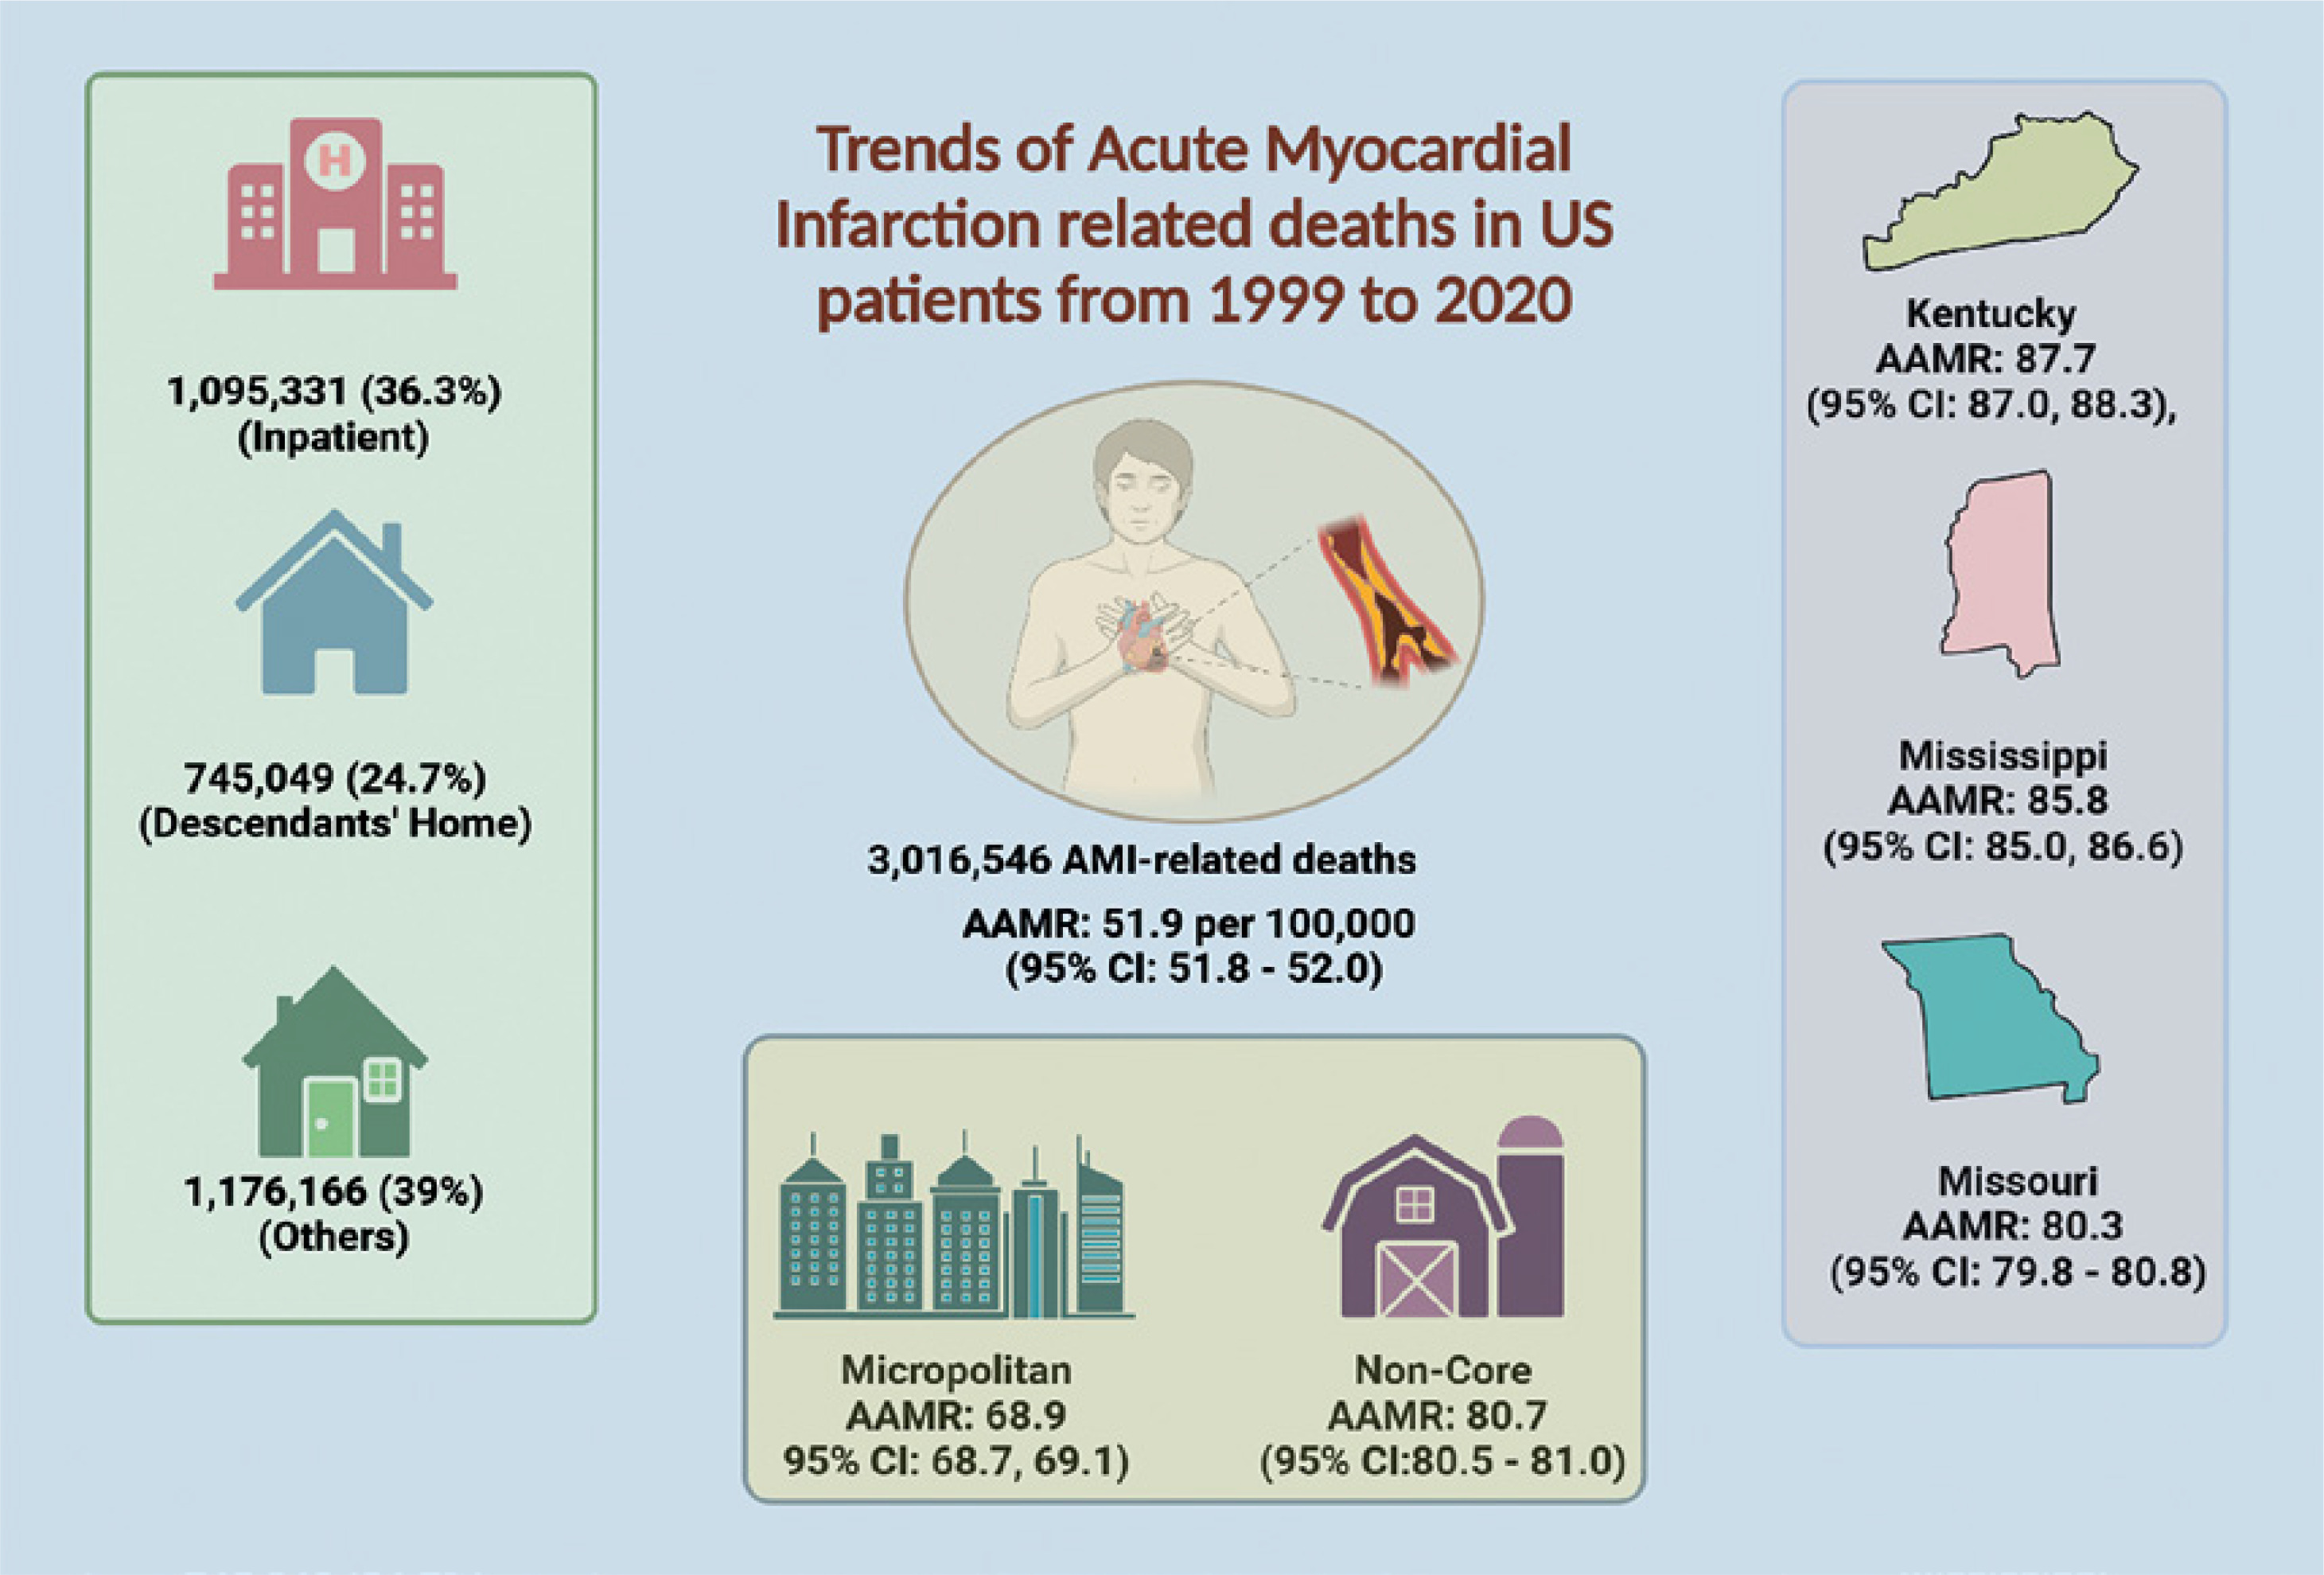
Between 1999 and 2020, 3,016,546 AMI-related deaths were reported in the US. Out of all the deaths, 1,095,331 (36.3%) occurred in inpatient medical facilities, 745,049 (24.7%) occurred in the descendant’s home and the remaining deaths occurred in other locations. The AAMR between 1999 and 2020 was 51.9 per 100,000 (95% CI: 51.8–52.0). Regarding the mortality trend, there was an overall average annual percent change (AAPC) of –5.01% (95% CI: –5.27, –4.76) with the AAMR decreasing from 93.2 (95% CI: 92.8, 93.6) in 1999 to 33.4 (95% CI: 33.2, 33.6) in 2020. From 1999 to 2010, there was a notable and steeper decline in AAMR (APC = –6.43; 95% CI: –6.74, –6.11) which was followed by a slower decline from 2010 to 2020 (APC = –3.43; 95% CI: –3.89, –2.96), as demonstrated in Table I and Figure 1.
Table I
Acute myocardial infarction deaths and age-adjusted mortality rates in the US population between 1999 and 2020, stratified by demographics and geographical variations
Figure 1
Trends in age-adjusted mortality rates related to acute myocardial infarction between 1999 and 2020
Mortality by age group
Over the course of the study, the crude mortality rate (CMR) increased with age. For example, the CMR for individuals over 85 was 762.1 (95% CI: 760.6, 763.7), and for those between 75 and 84 years old, it was 285.2 (95% CI: 284.6–285.8). The age groups that had the highest AAPC were those between the ages of 35 and 44 (AAPC = –2.41; 95% CI: –3.23, –1.59) and 45 and 54 (AAPC = –2.95, 95% CI: –3.24, –2.65), while the age group over 85 had the lowest AAPC (AAPC = –5.57; 95% CI: –6.00, –5.13).
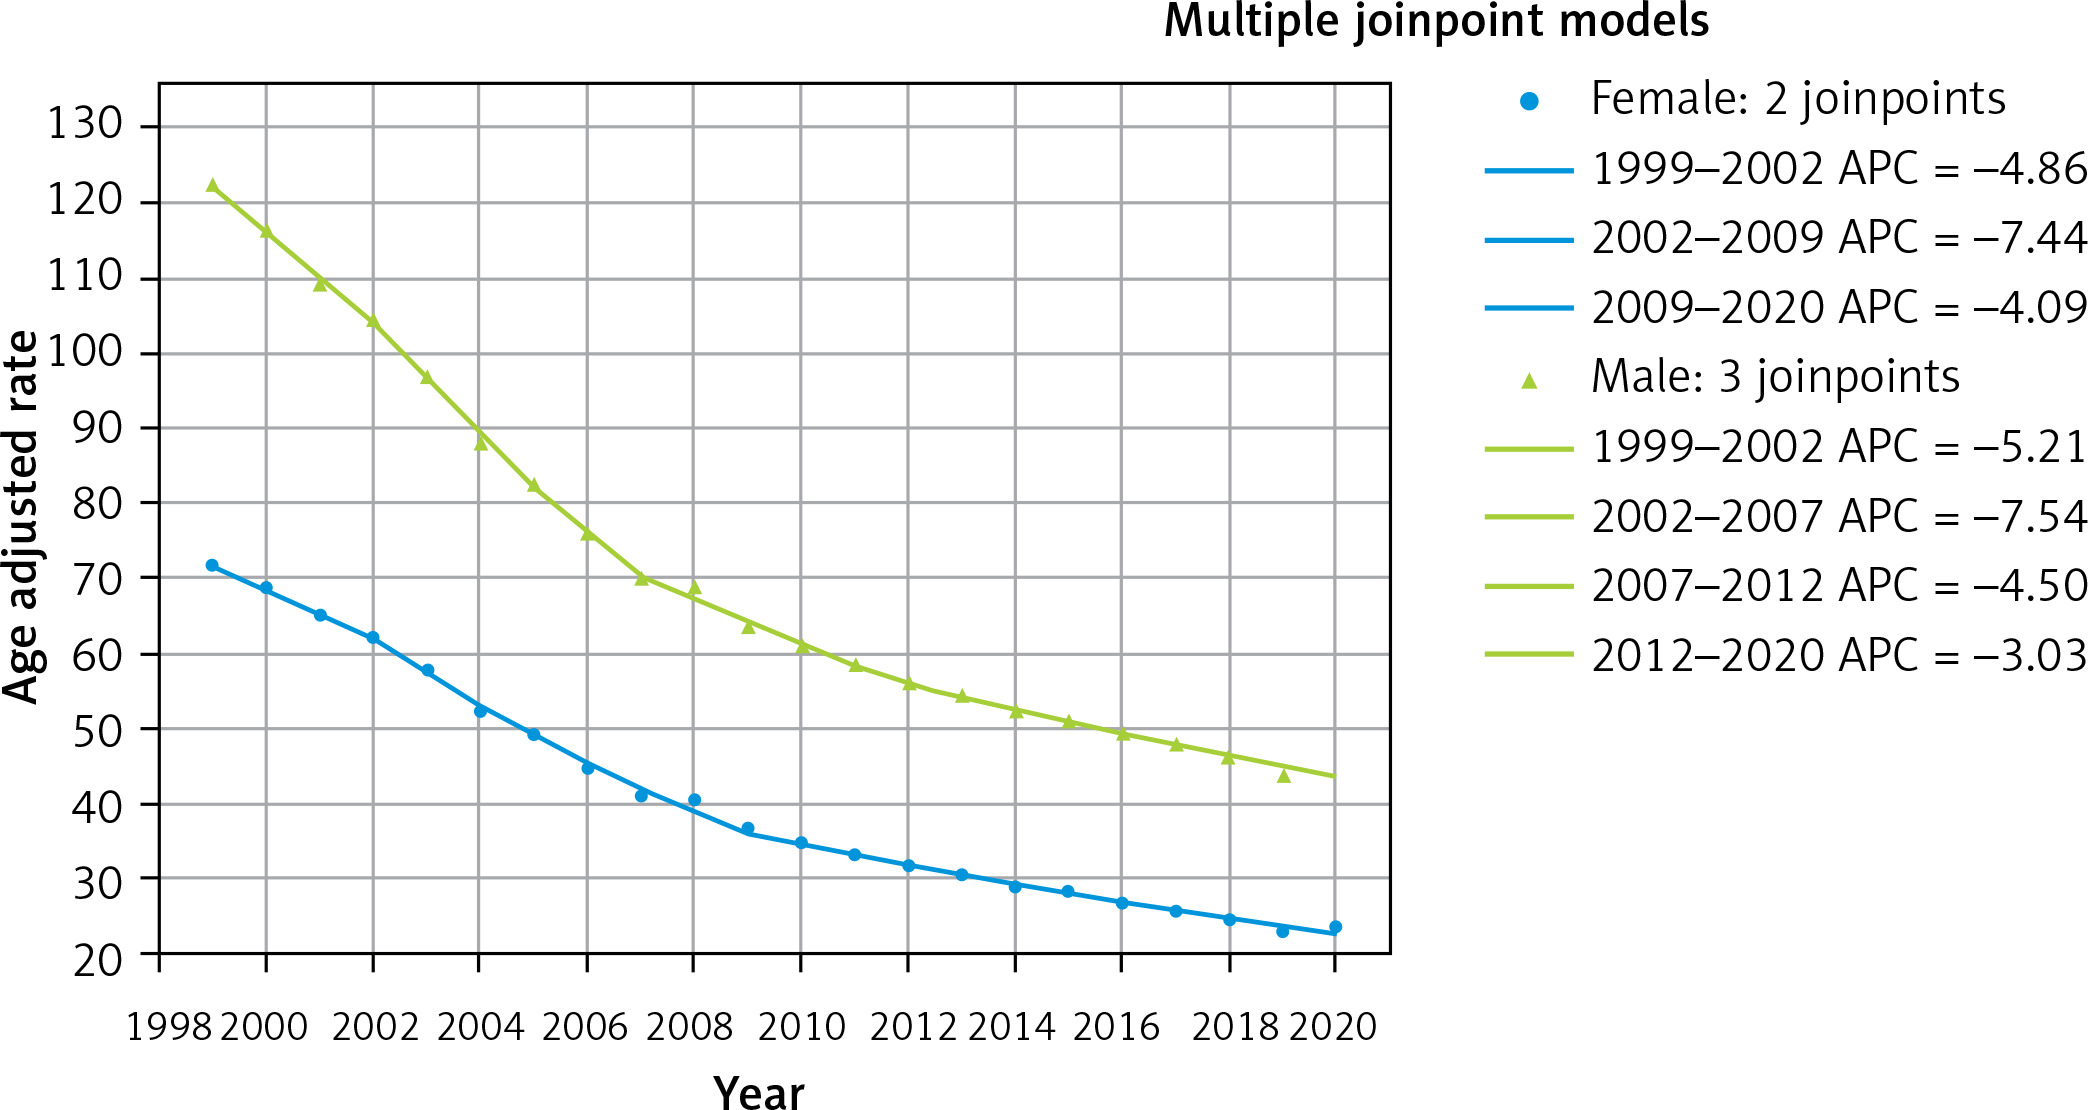
Mortality stratified by gender
Males exhibited a consistently higher annual AAMR with an average AAMR from 1999 to 2020 of 67.4 (95% CI: 67.3, 67.5) compared to 39.5 in females (95% CI: 39.4, 39.6). Similar to the population as a whole, both males and females had a downward trending AAMR between 1999 and 2020. However, males had a less negative AAPC (–4.7804; 95% CI: –5.2777, –4.2805) through this period in comparison to females (AAPC = –5.3271; 95% CI: –5.7323, –4.9202), indicating a slower average annual decline (Figure 2). Males died at a rate of 54.8% overall compared to females’ 45.2% (Figure 2).
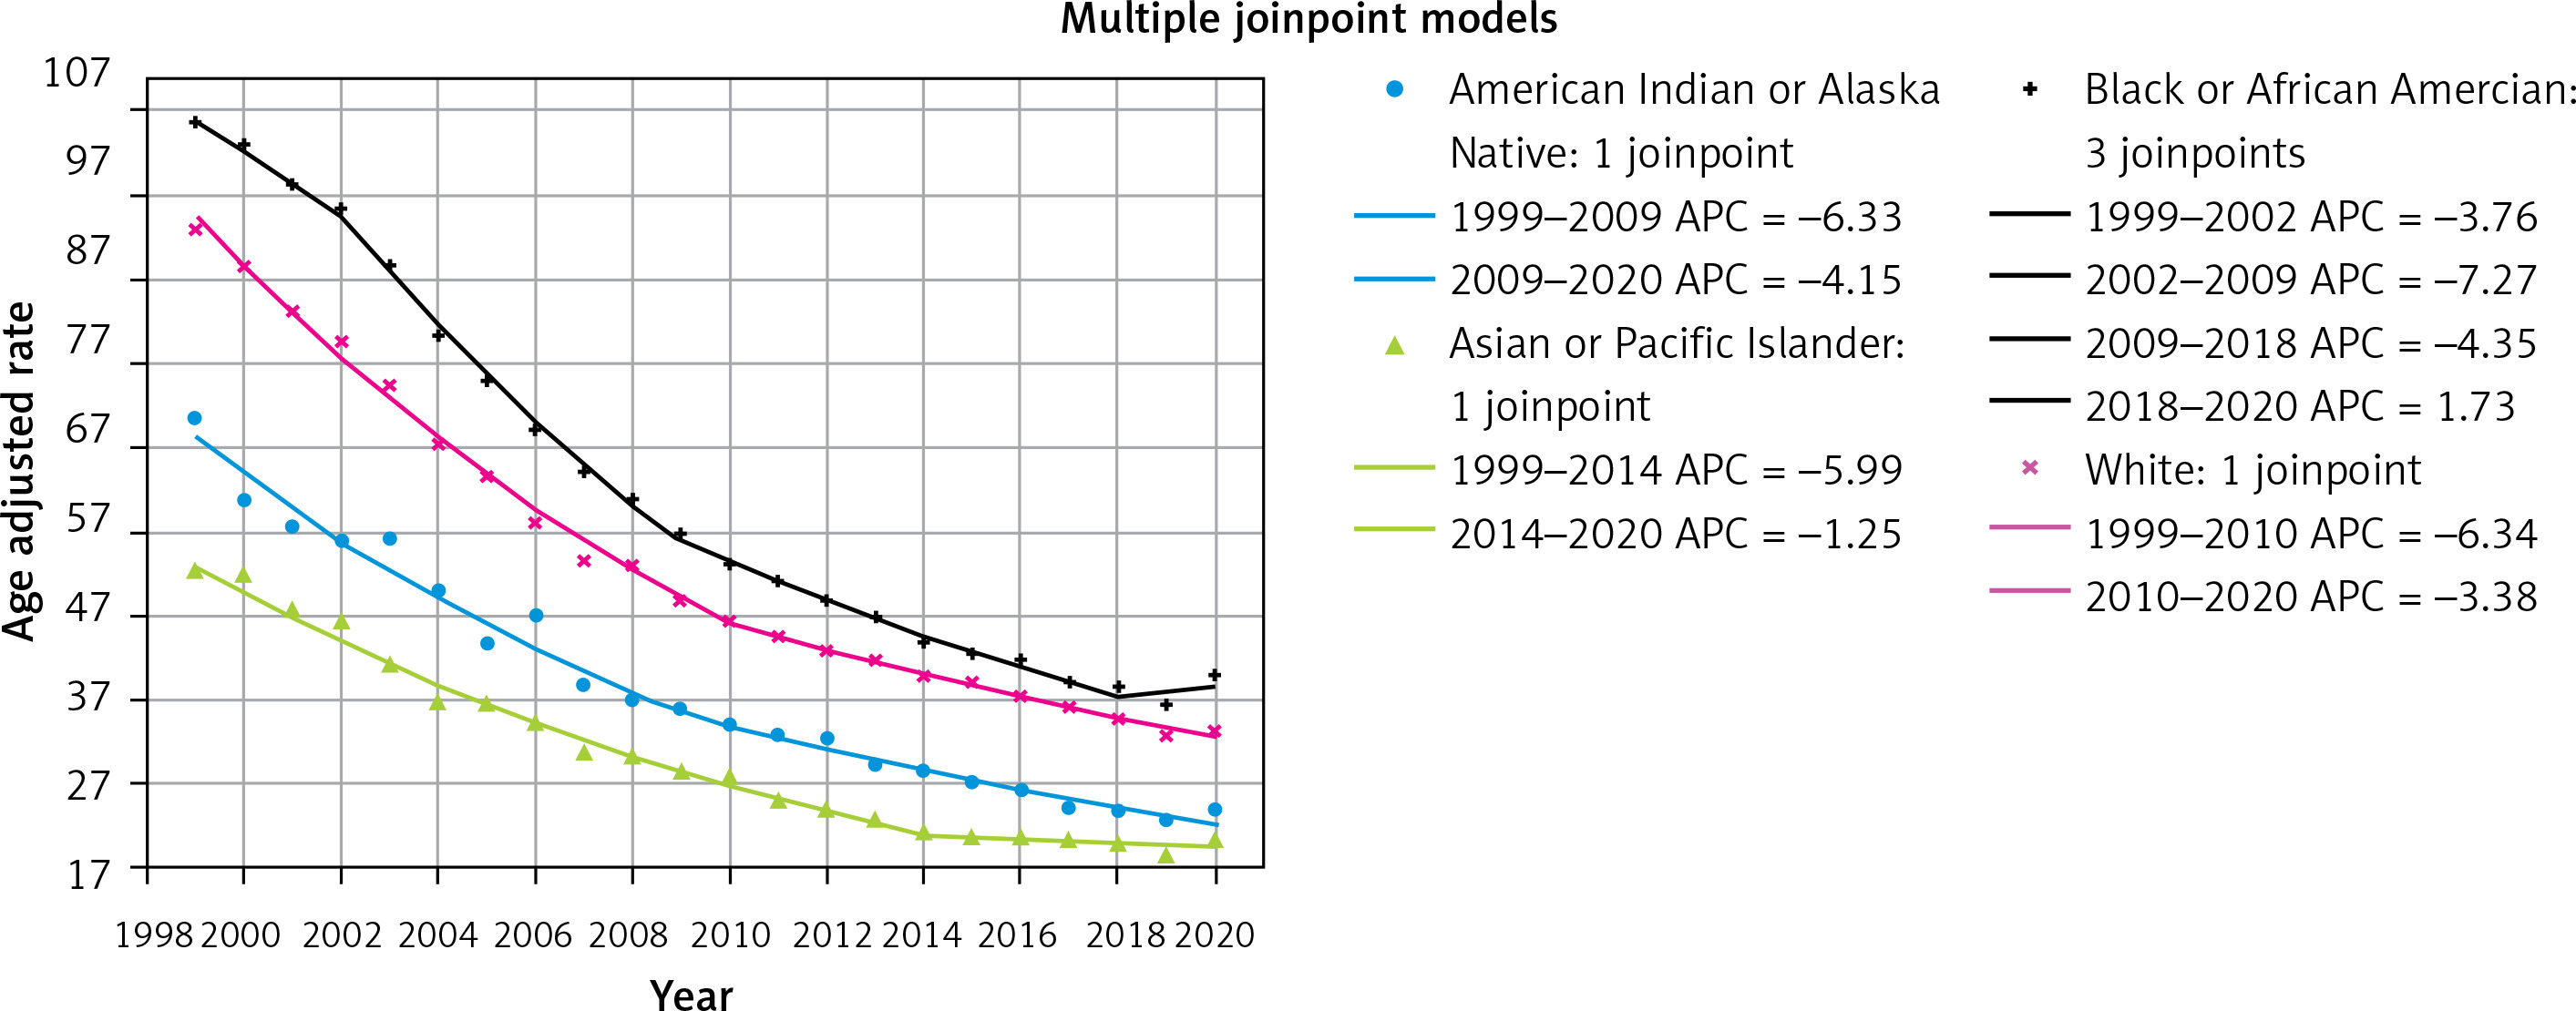
Mortality stratified by race/ethnicity
Black or African American people had the highest overall mortality between 1999 and 2020 (AAMR = 58.9; 95% CI: 58.7, 59.1), while Hispanic or Latino people had the lowest overall AAMR (38.1; 95% CI: 37.9, 38.3). In terms of the mortality trend, the least negative AAPC was found in people from Asia or the Pacific Islands (AAPC = –4.66; 95% CI: –5.19, –4.13) indicating the slowest rate of decline in mortality over the years. The AAPC for non-Hispanic Black individuals was –4.6925 (95% CI: –5.14, –4.24). AAPC for White was -4.94 (95% CI: –5.15, –4.73). Lastly, the most negative AAPC was seen in American Indians or Alaska Natives at –5.19 (95% CI: –5.81, –4.58), indicating the greatest rate of decline in mortality (Figure 3).
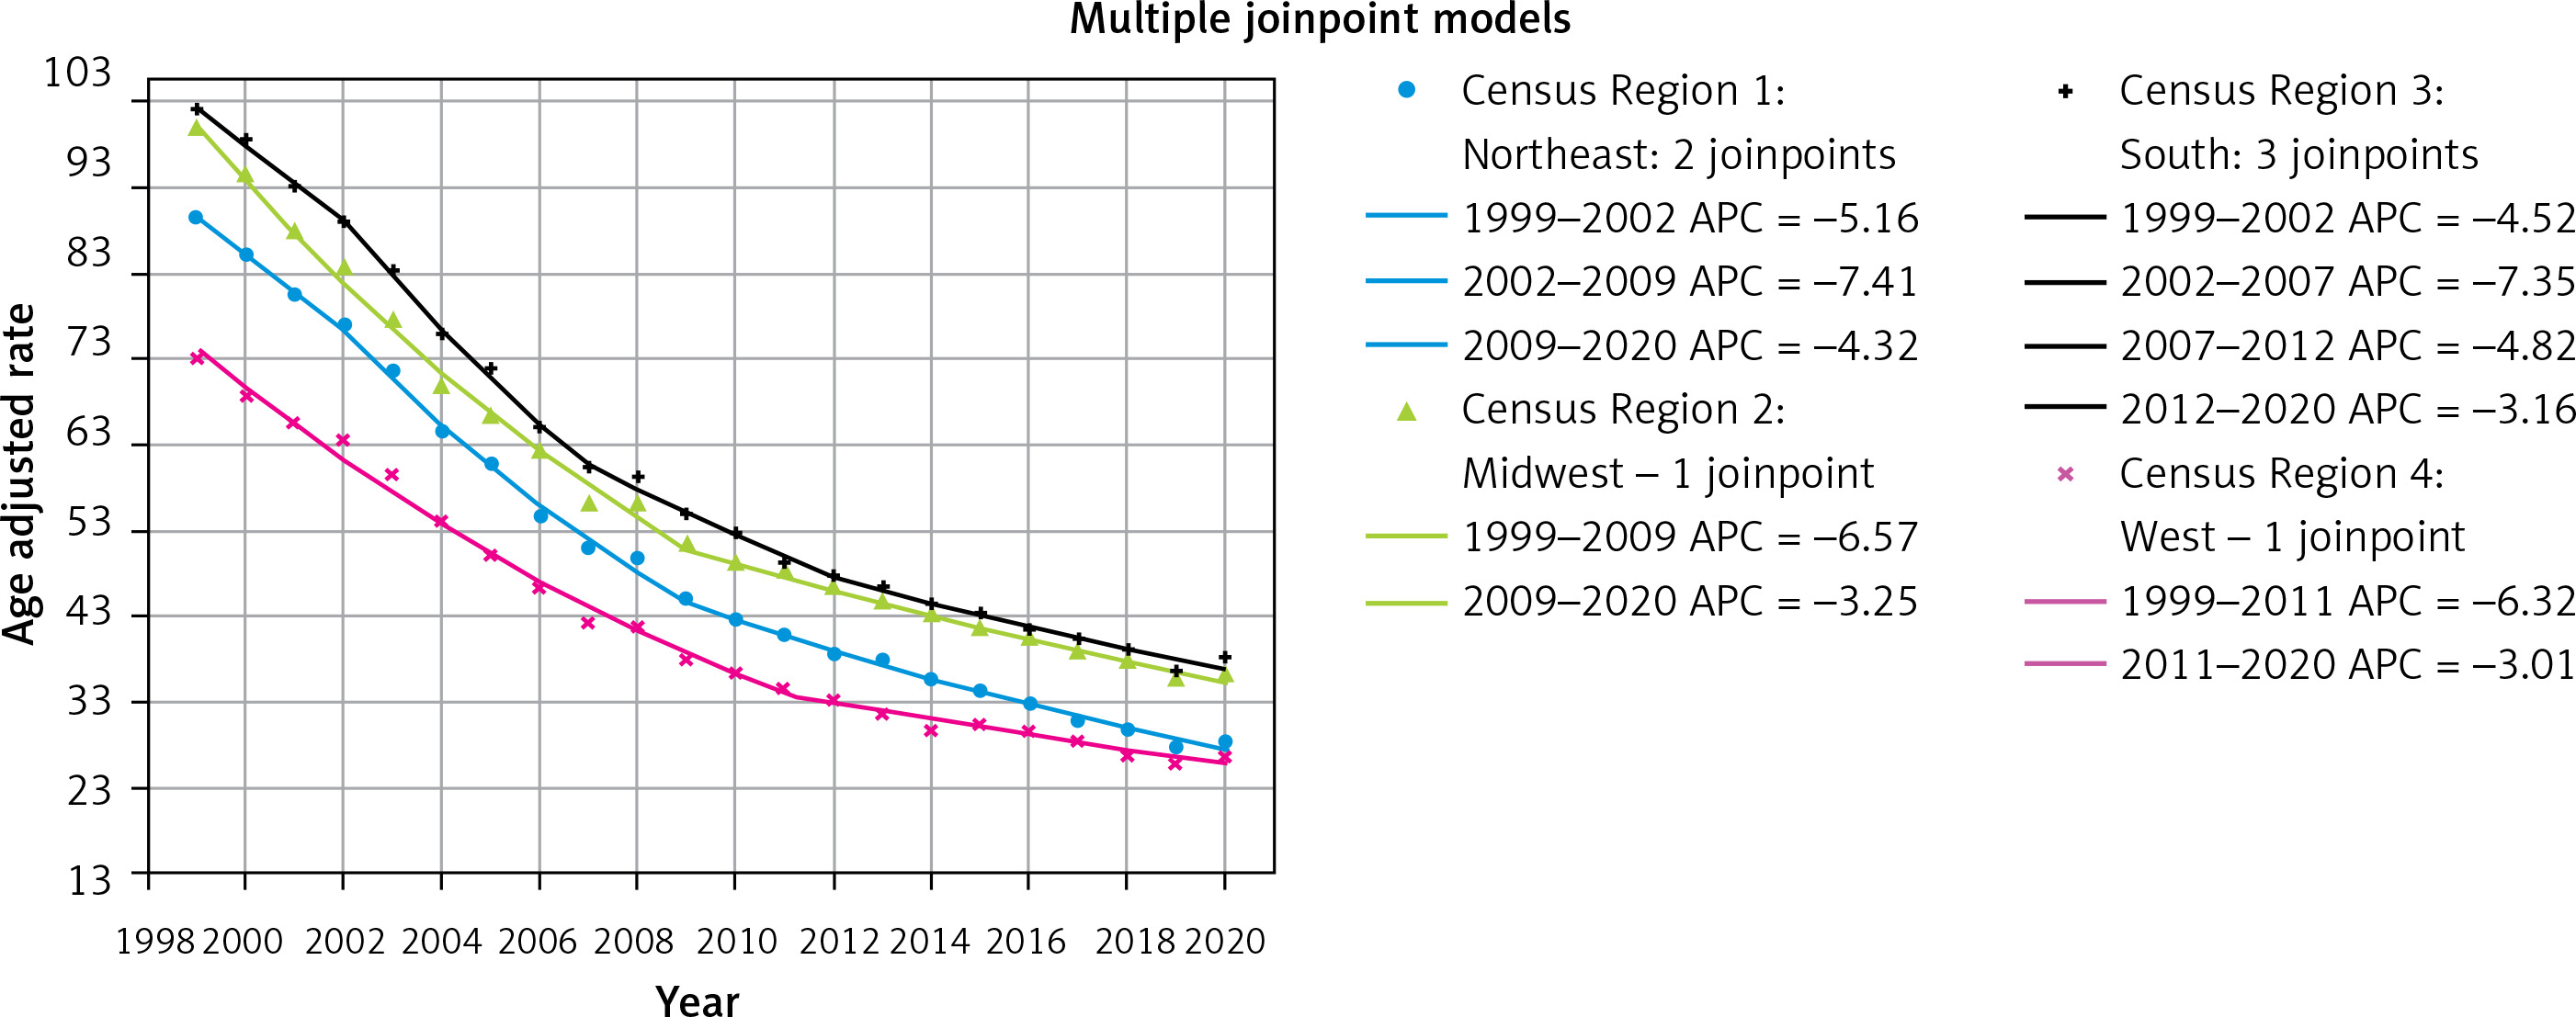
Mortality stratified by geographical region and county
The South region of the US had the highest AAMR from 1999 to 2020 (57.7; 95% CI: 57.6, 57.8), whereas the West region had the lowest AAMR (40.3; 95% CI: 40.2, 40.4). All regions had a downward trending mortality rate, with the Northeast region having the most negative AAPC (–5.48; 95% CI: –5.90, –-5.06) and the South region having the least negative AAPC (–4.76; 95% CI: –5.28, –4.24) (Figure 4).
Figure 4
Trends in age-adjusted mortality rates related to acute myocardial infarction stratified by geographical region between 1999 and 2020
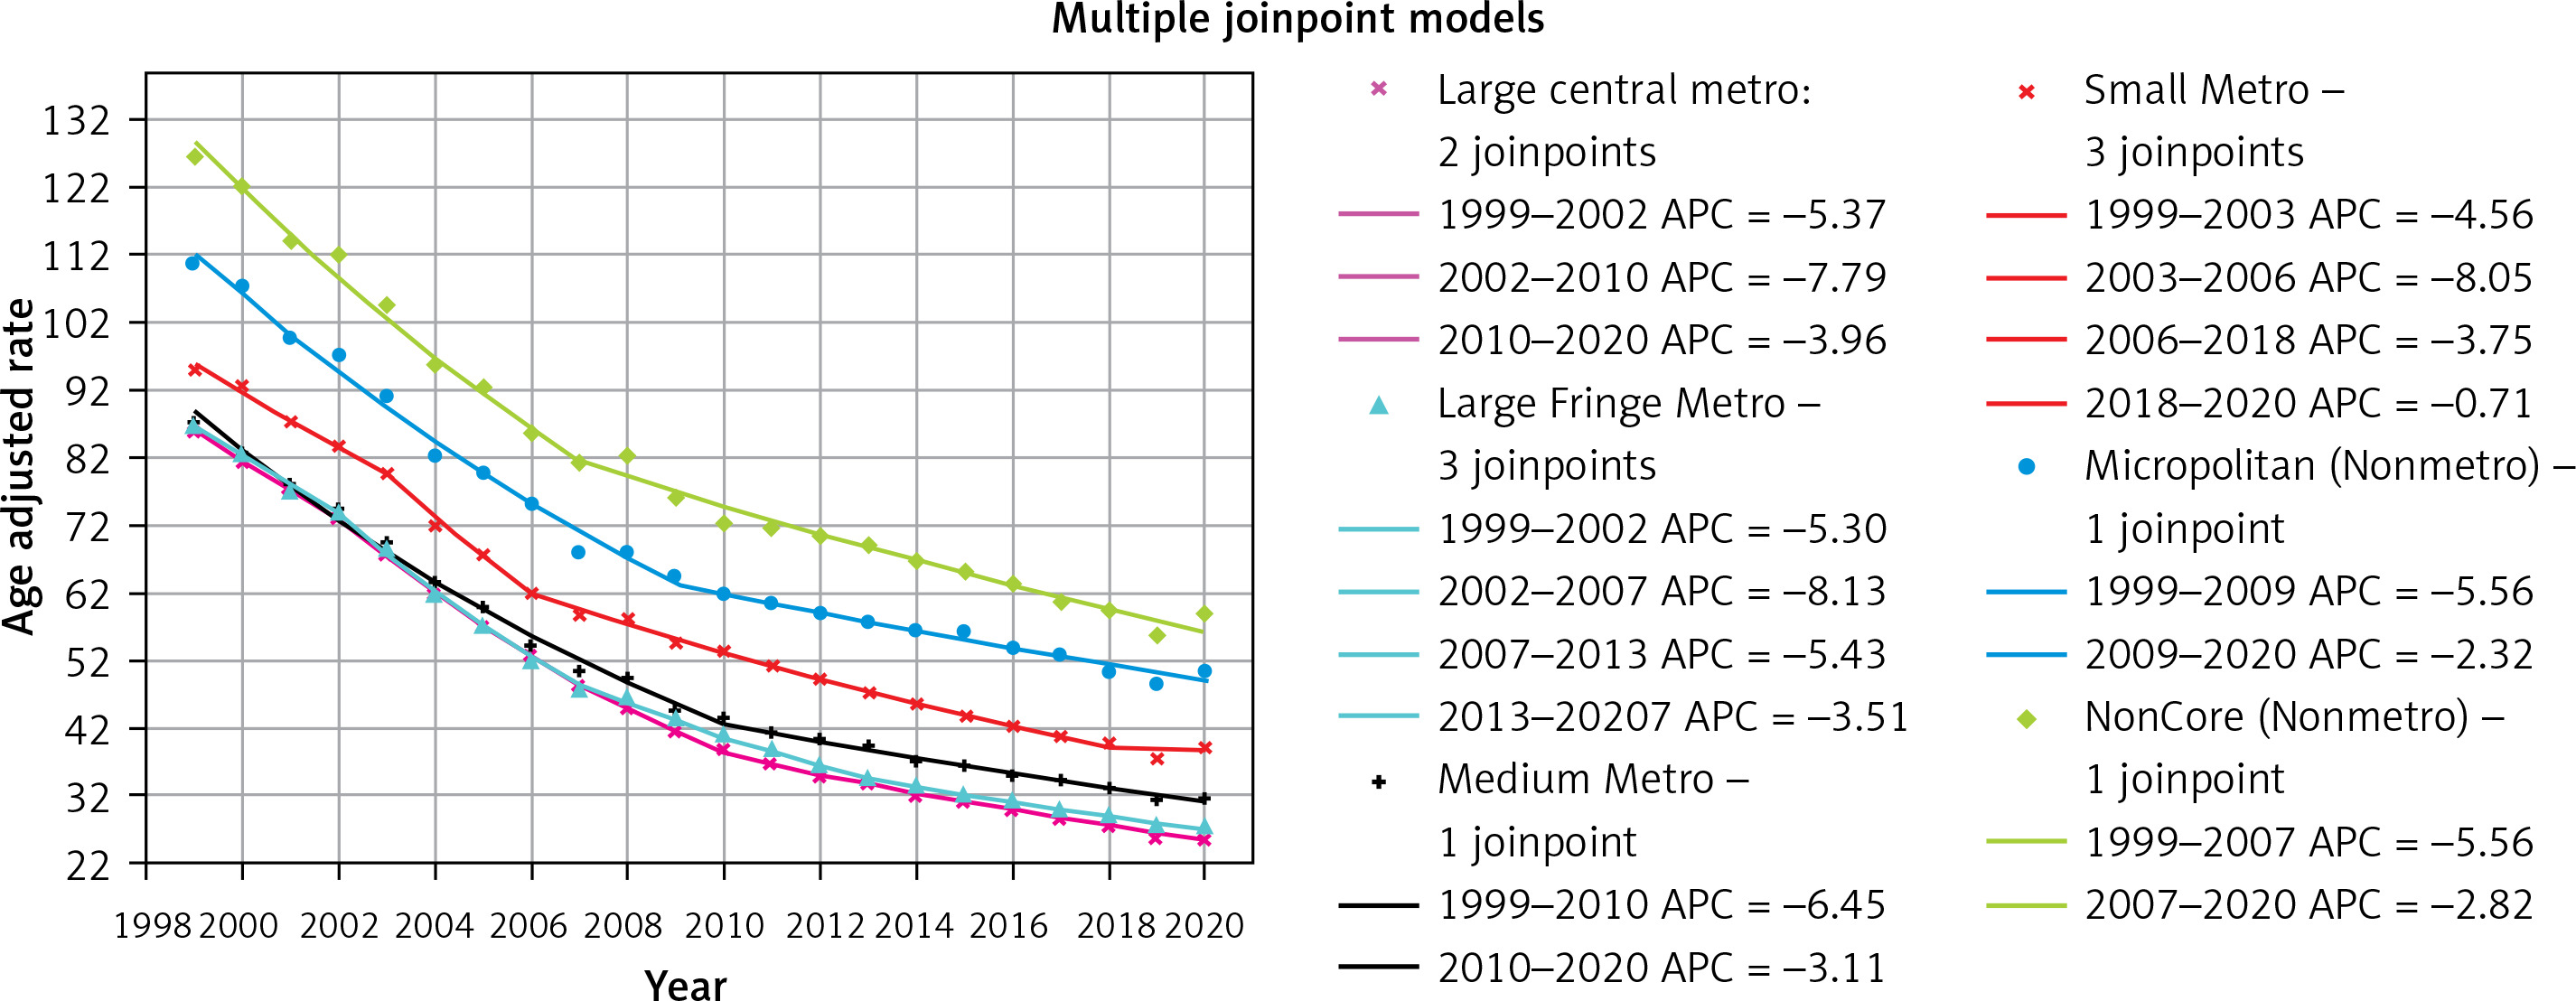
In terms of counties in the US, the Noncore (Nonmetro) counties had the highest AAMR from 1999 to 2020 (80.7; 95% CI: 80.5, 81.0), whereas the Large Central Metro counties had the lowest AAMR (45.0; 95% CI: 44.9, 45.1). Large Central Metro counties had the most negative statistically significant AAPC (–5.64; 95% CI: –6.03, –5.25). However, the least negative AAPCs were found in rural Noncore (Nonmetro) and Micropolitan (Nonmetro) counties (–3.87; 95% CI: –4.17, –3.57 and –3.88; 95% CI: –4.16, –3.60 respectively) (Figure 5).
Figure 5
Trends in age-adjusted mortality rates related to acute myocardial infarction stratified by urbanization level of counties between 1999 and 2020
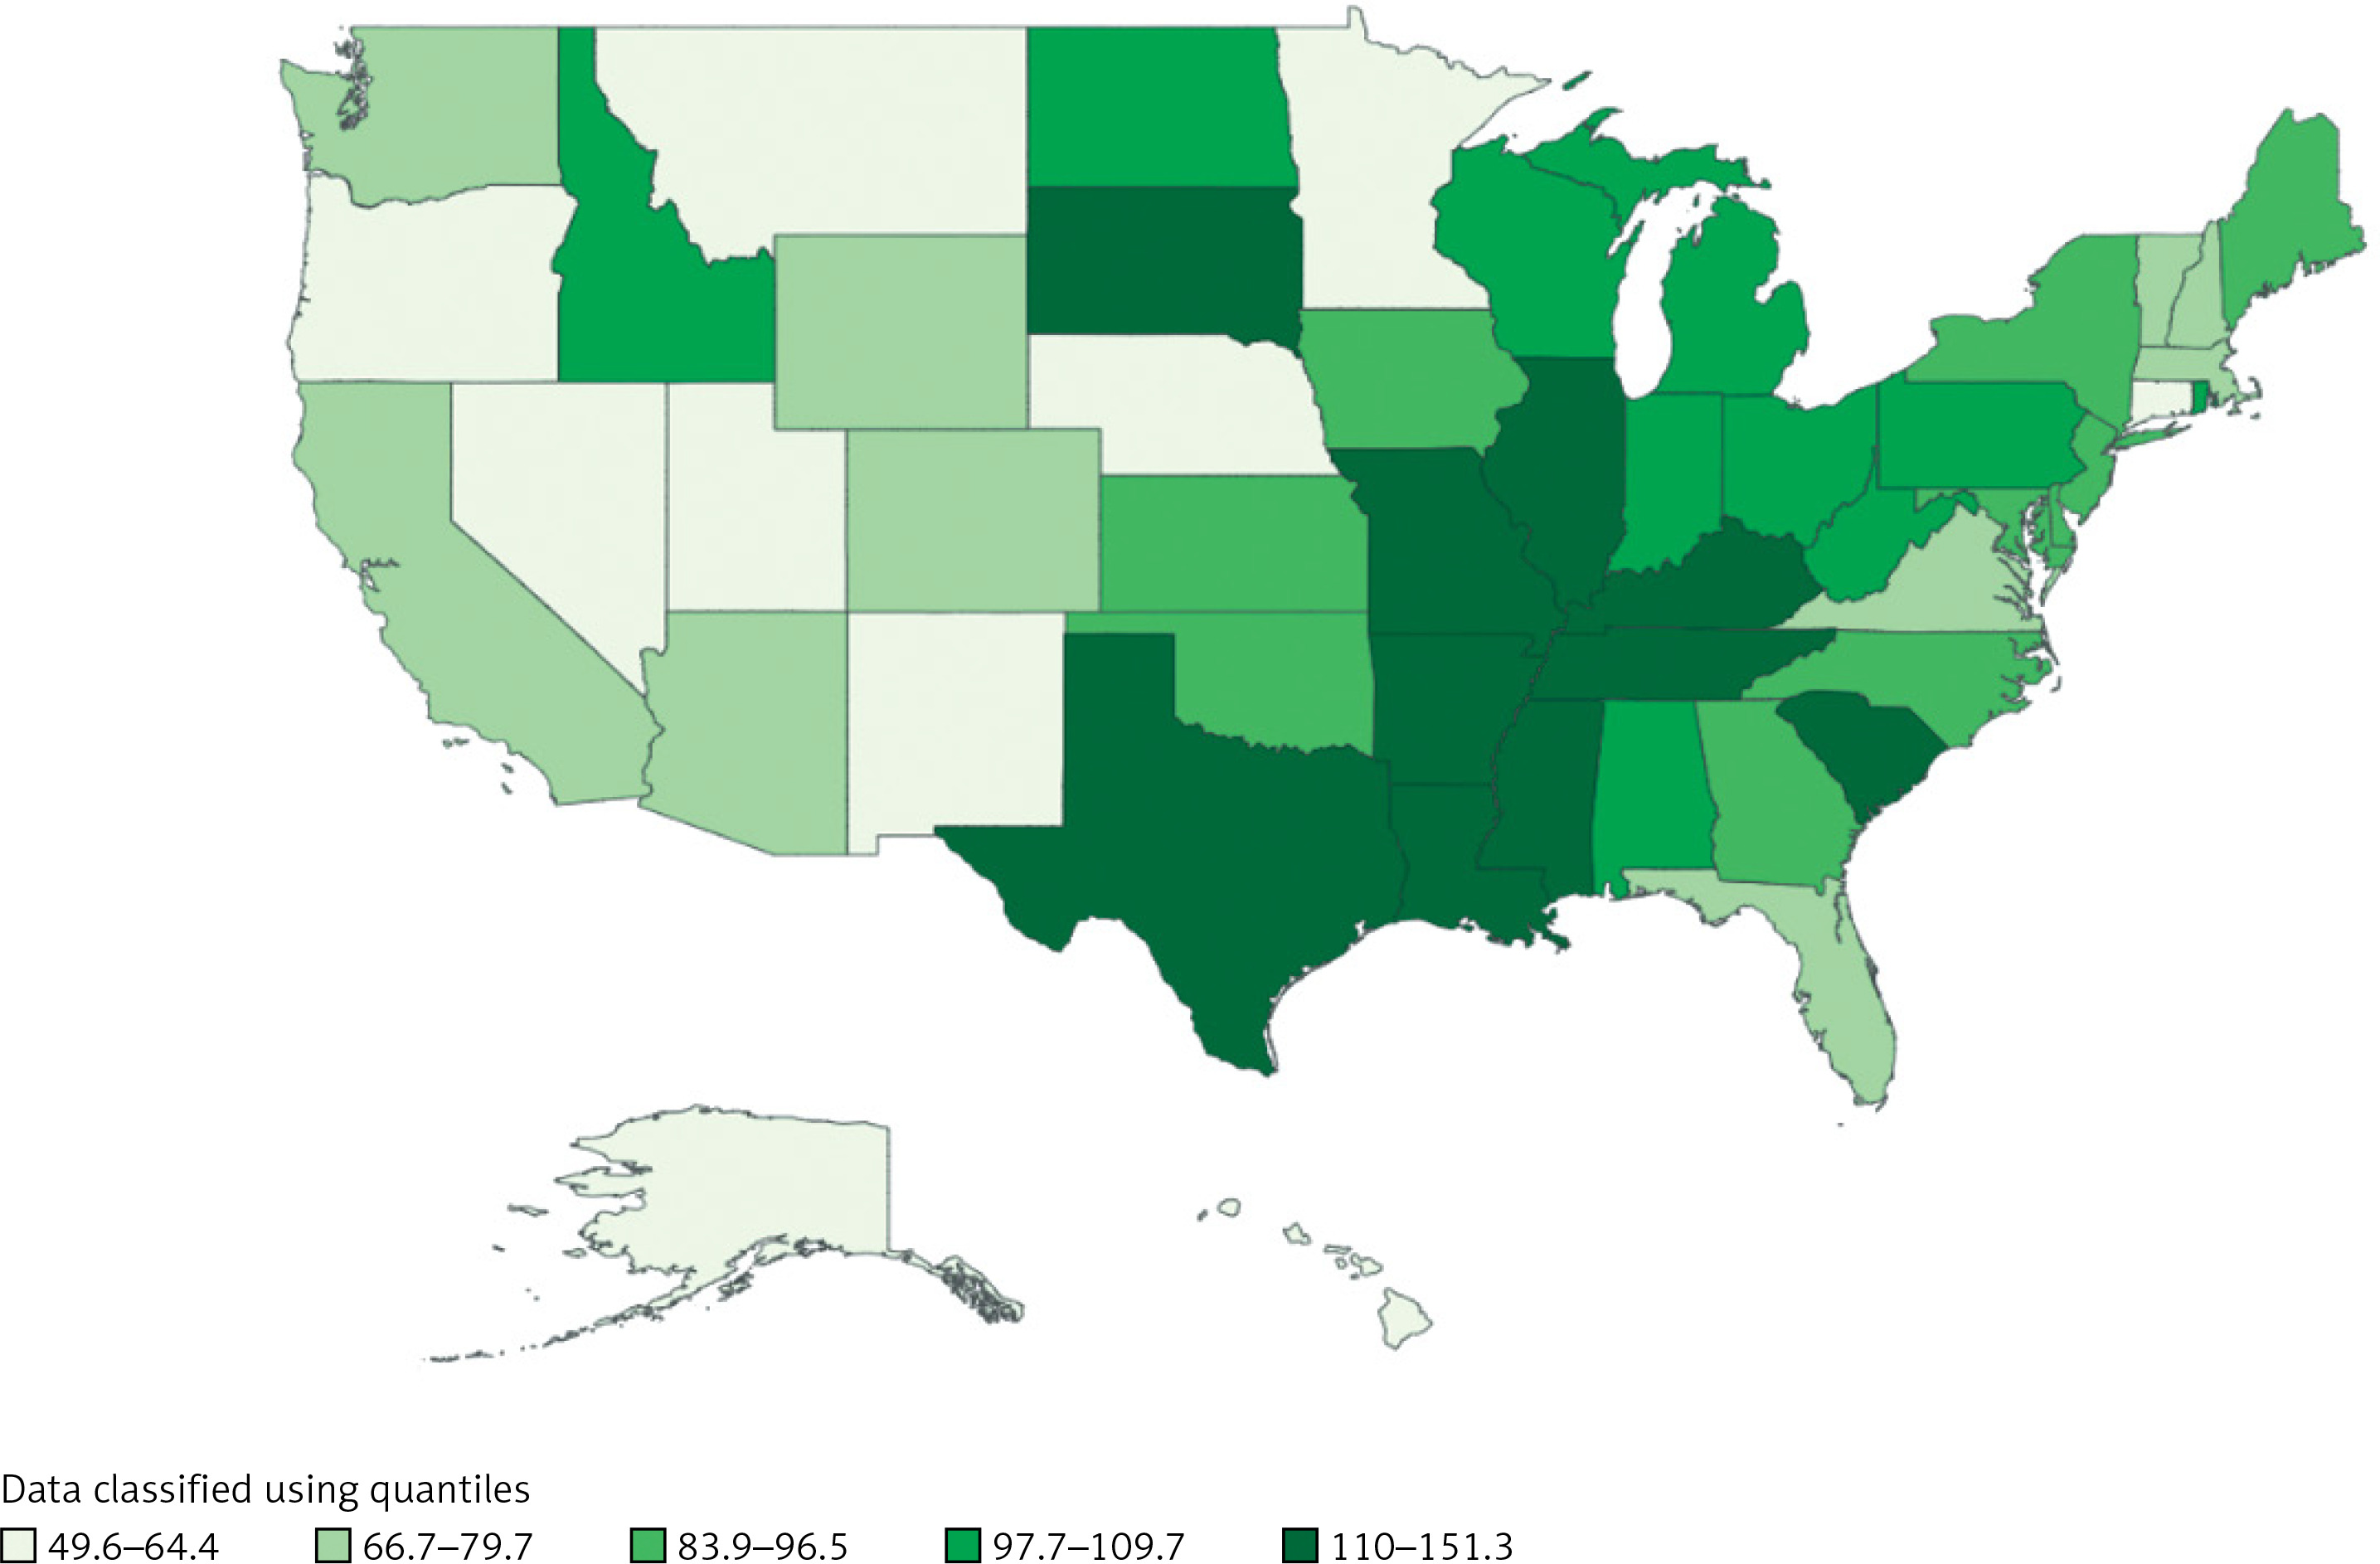
Delving deeper into specific states, AAMR from 1999 to 2020 was highest in Kentucky (87.7; 95% CI: 87.0, 88.3), followed by Mississippi (85.8; 95% CI: 85.0, 86.6) and Missouri (80.3; 95% CI: 79.8–80.8) (Figure 6).
Discussion
We present numerous important conclusions from this 21-year study of CDC mortality data. The AMI-related AAMR decreased at an accelerated rate between 1999 and 2010, and then decreased more gradually between 2010 and 2020. The causes of this decline are complex and range from health-promoting and prevention activities to treatment during and after a heart attack. These can include changes in public lifestyles, better healthcare services, elevated heart health awareness, and medical technology breakthroughs. Nonetheless, a rise in the overall AAMR was noted in 2020 (APC = 33.4), which may have been caused by the COVID-19 pandemic, which has had a major effect on healthcare systems and Global Health (Figure 7).
Figure 7
Central illustration highlighting overall AMI-related deaths, stratified by setting, as well as the AAMR with geographical stratification between 1999 and 2020
Men and women both followed this pattern, with men consistently having a higher AAMR than women. This could be attributed to a combination of social and biological factors such as males being more likely to engage in unhealthy habits such as smoking [10] and females having higher levels of cardioprotective estrogen before menopause [11].
Secondly, the Black or African American population had the highest AMI-related AAMR in comparison to other racial groups. Previous research has also found that the Black/African American population had a greater age-adjusted rate of cardiovascular disease, death or incidence [12, 13]. Variation in the pathophysiology and underlying cause of AMI may potentially influence the differences in results. According to Jolly et al., the higher burden of traditional risk factors and lower socioeconomic status in young to middle-aged Blacks compared to Whites may be responsible for the elevated cardiovascular disease prevalence [14]. These factors account for a significant portion of the observed differences; however, some excess prevalence remains, indicating the possible influence of unaccounted factors [14]. Additionally, as previously mentioned, a rise in the AAMR was noted in 2020 for every race that was examined.
The regional and county AAMRs decreased in line with the general trends. We also noted significant regional differences in AMI-related mortality, with the South region of the US having the highest burden when compared to other regions. The regional variations in AMI-related mortality are influenced by a multitude of factors. Among the most crucial factors are healthcare accessibility and quality. A similar study conducted in Beijing [15] found that areas with greater access to medical care generally have lower rates of AMI mortality. A significant number of deaths were observed in the descendants’ home, which can be attributed to sudden cardiac arrest. Other factors that may contribute to regional variations in AMI-related mortality in the US include lifestyle, socioeconomic status, and the prevalence of risk factors such as obesity, smoking, and hypertension. In the absence of studies or data that are particular to the South, it is challenging to pinpoint the exact reasons for the higher AMI-related mortality in this region of the country.
Lastly, we found that, when compared to metropolitan areas, nonmetropolitan areas bear the greatest burden of AMI-related death, with Noncore counties bearing the highest burden. This may be the result of several factors. For example, in comparison to metropolitan areas, nonmetropolitan communities frequently have lower accessibility to healthcare services. This includes fewer medical facilities and expertise, which may cause AMI treatment to be delayed or to be suboptimal. Secondly, a sizable portion of deaths in rural areas are regarded as “potentially excess deaths”, which means that they could have been avoided with prompt and efficient medical attention. This implies that enhancing the quality and accessibility of healthcare could lower the mortality rates associated with AMI in these regions [16, 17].
Several limitations of this study must be considered, partly due to the constraints of the data available in the CDC WONDER database. Firstly, the use of ICD codes and death certificates increases the possibility that AMI will be mislabeled or omitted as a cause of death. Secondly, the database is deficient in clinical variables that could be used to more accurately characterize AMI, such as vital signs, laboratory results, echocardiographic data, and genetic analysis. Thirdly, there is a lack of information regarding medical therapy and AMI treatment. Finally, there was a lack of information on the socioeconomic determinants of health, which could have an impact on access to care.
In conclusion, there was a significant decrease in the overall age-adjusted mortality rate linked to acute myocardial infarction between 1999 and 2020. It is noteworthy that males, Black/African American adults and those living in the South and nonmetropolitan areas of the US consistently had the highest AAMRs. Targeted interventions are necessary to address and reduce the rising rates of AMI-related mortality among older adults in light of these disparities.