Introduction
Coronavirus disease 2019 (COVID-19), a new condition that first appeared in December 2019, stems from the severe acute respiratory syndrome coronavirus 2 (SARS-CoV2) virus. Due to the virus’s rapid spread and contagious nature, on 11th March 2020, the World Health Organization (WHO) announced that COVID-19 was a global pandemic [1]. Initially, it appeared that COVID-19 patients presented mostly with respiratory symptoms such as cough and dyspnea, along with common symptoms of fatigue, fever, myalgia, and headache. However, as the pandemic progressed, there were several reports of the impact of the virus on the cardiovascular system. Complications such as thrombosis, ischemic stroke, cardiac arrhythmias, myocarditis, takotsubo, cardiac arrest, myocardial ischemia and infarction, deep vein thrombosis, and pulmonary embolism have all been reported [2–14].
The National Inpatient Sample (NIS) is the biggest freely accessible hospital database that is created as part of the Healthcare Cost and Utilization Project (HCUP), and supported by the Agency for Healthcare Research and Quality. It includes 20% of all US hospitalizations, which can be expanded to include over 97% of all cases nationally. Prior studies investigating the impact of COVID-19 during the first year were reported via the NIS 2020 [15–22]. As the NIS 2021 was recently released, we aim to provide a more extensive update on how the pandemic fared over its first 21 months [23].
Material and methods
Patients with a code of active COVID-19 were recruited using the ICD-10 codes U071 and J1282. We only considered patients who were aged 18 years or older. Using SPSS 29.0, we further included the ICD-10 codes for acute pulmonary embolism (APE), deep vein thrombosis (DVT), cardiac arrest (CA), acute ischemic stroke (AIS), myocarditis, and takotsubo cardiomyopathy (TC). The trends of the above conditions and the overall all-cause mortality were explored via linear-by-linear association analyses. As there were cells containing less than 11 patients/month , the incidence of TC was reported on a quarterly basis, at a per 100,000 COVID-19 rate [23, 24].
Results
Trends in COVID-19 cases
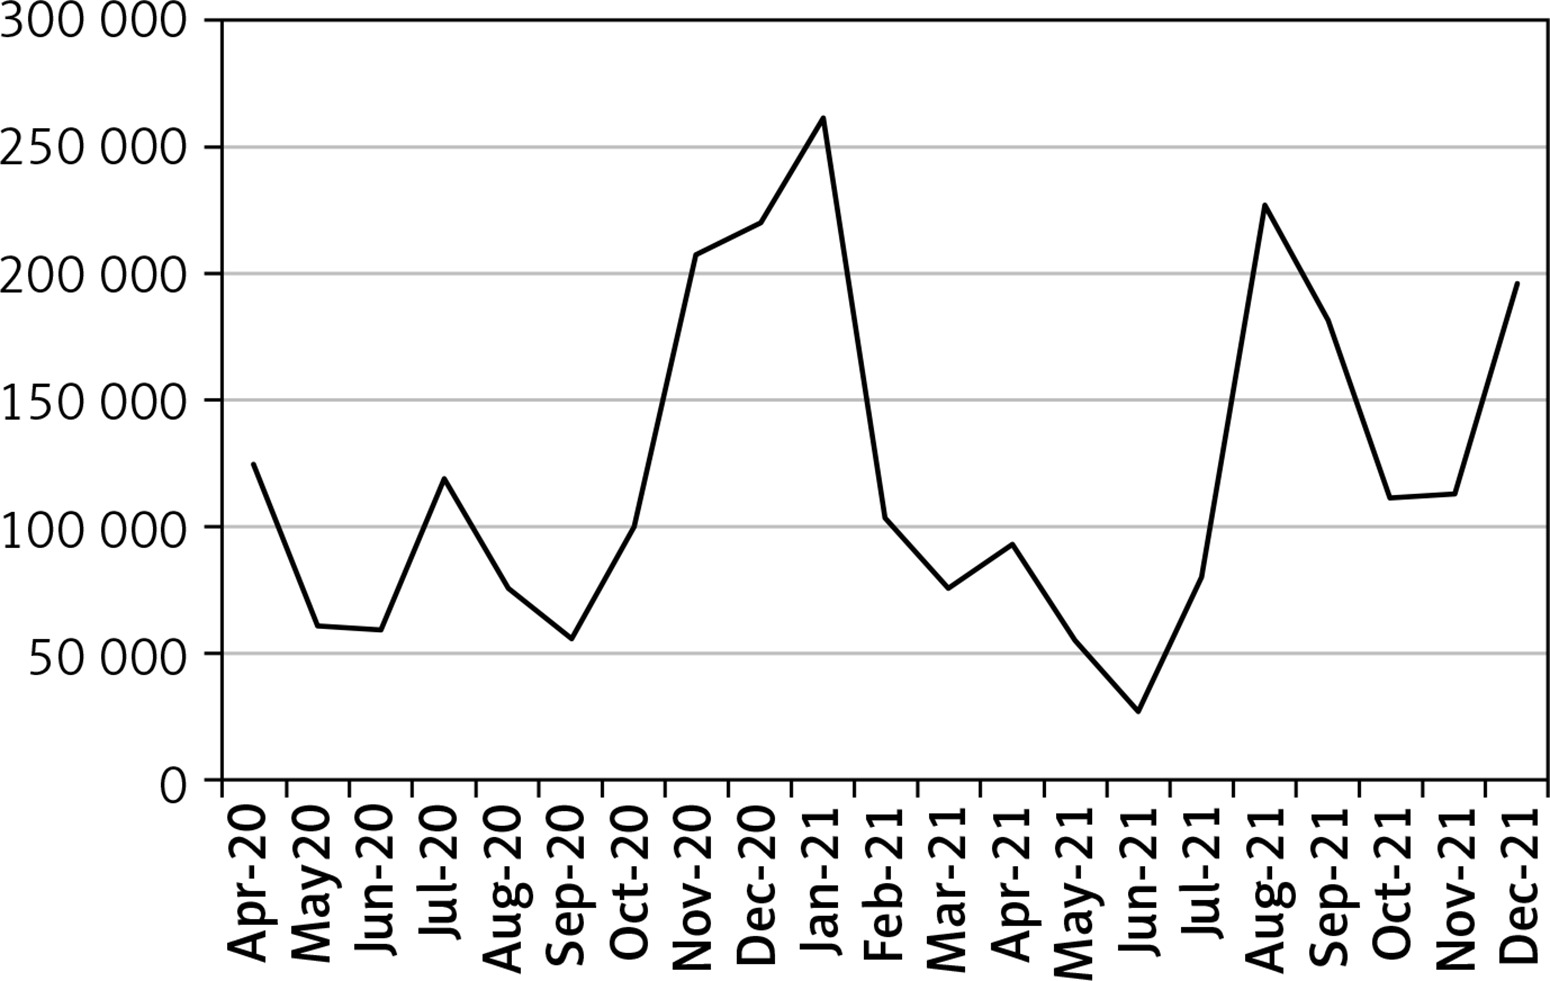
The peak number of COVID-19 cases in the period April 2020-December 2021 was seen in January 2021, when 261,469 adults sought treatment. Between April and September 2020 minor fluctuations were seen, and from September 2020 to January 2021 the hospitalizations due to COVID-19 rose sharply. From January 2021 to June 2021, the number of cases started dropping as it reached a record low of 26,860 in June 2021. However, from June 2021 to August 2021 there was another rise (22,7129 cases in August 2021). Finally, after August 2021, the number dropped until October 2021, and in December 2021, it rose to 195,600 cases (Table I, Figure 1, ptrend < 0.01).
Table I
Incidence of complications seen in COVID-19 cases admitted between April 2020 and December 2021
Trends in events of acute pulmonary embolism
Over the 21 months of our study, we found that the percentage of COVID-19 patients reporting APE events generally rose from 2.08% in April 2020 to reach a maximum incidence of 4.82% in November 2021. In December 2021, the rate dropped to 3.85% (Table I, Figure 2, ptrend < 0.01).

Trends in events of deep vein thrombosis
Initially events of DVT dropped from 1.74% in April 2020 to 1.20% in June 2020, and the rate stayed almost constant until December 2020 (1.30%). However, from December 2020, a rise was seen, to reach 2.42% in May 2021, followed by a drop until July 2021 (1.84%), and another rise until December 2021 (2.63%) (Table I, Figure 3, ptrend < 0.01).

Trends in events of cardiac arrest
An overall decreasing trend in incidence of cardiac arrest was seen between April 2020 and June 2021, from 2.80% to 1.58%. However, there were increasingly more cases between June 2021 and August 2021 (3.00%). Between August 2021 and October 2021, fewer events of cardiac arrests were seen (2.07% in October 2021). During the last two months of 2021, the number of cases rose again, as compared to October, and reached 2.58% in December 2021(Table I, Figure 4, ptrend < 0.01).

Trends in events of acute ischemic stroke
Our study noted that the overall incidence of AIS dropped between April 2020 (0.88%) and December 2020 (0.55%). However, a rise was seen in January 2021 (0.92%), and the number dropped again to reach 0.64% in April 2021. From April to December 2021, the incidence fluctuated, with an overall increasing trend, to attain a rate of 0.86% at the end of our study period (Table I, Figure 5, ptrend < 0.01).

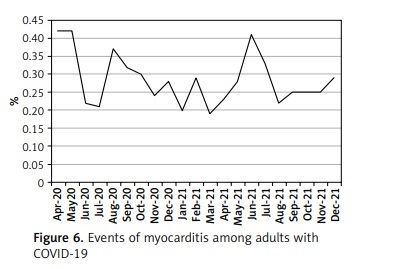
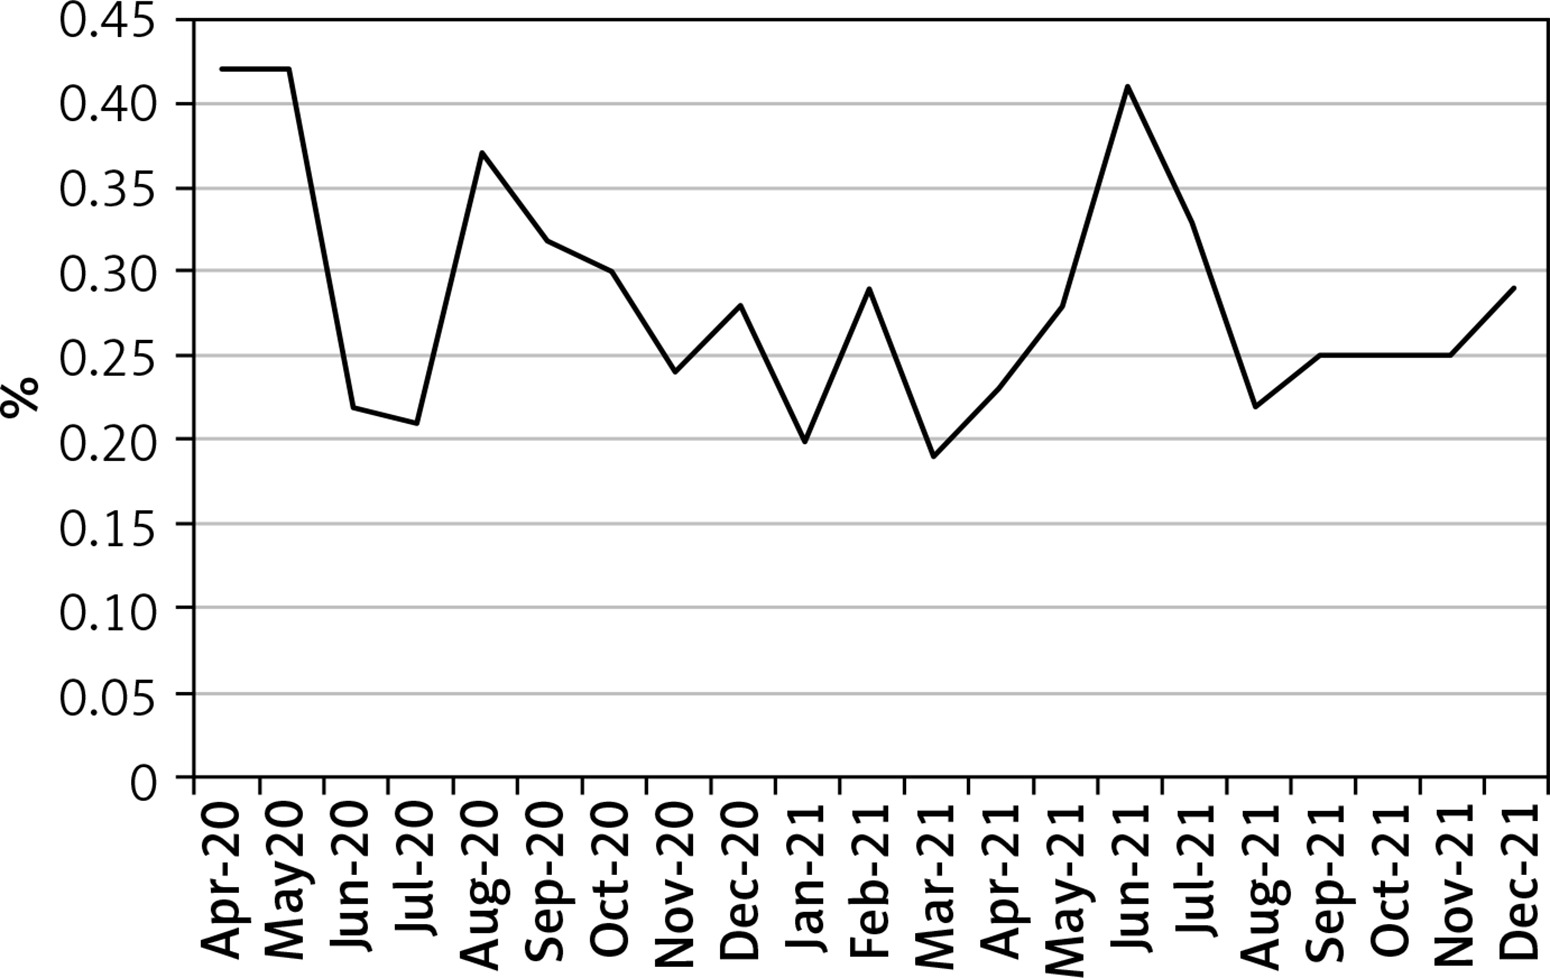
Trends in events of myocarditis
Various changes in events of myocarditis were observed. A drastic drop was seen between May 2020 (0.42%) and June 2020 (0.22%), and the number rose again in August 2020 (0.37%), followed by a decreasing trend until March 2021 (0.19%). A second peak was seen in June 2021 (0.41%) as the numbers of myocarditis soared, before eventually a decrease in the incidence occurred until August 2021 (0.22%). Finally, between August 2021 and December 2021, the incidence almost plateaued before rising in December to 0.29% (Table I, Figure 6, ptrend < 0.01).
Trends in rate of Takotsubo cardiomyopathy
Between April/June 2020 and April/June 2021, the incidence dropped from 96 per 100,000 to 49 per 100,000, and a transient rise occurred in October/December 2020 (84 per 100,000 COVID-19 cases). From April/June 2021 to October/December 2021, the incidence of TC rose to reach 111 per 100,000 COVID-19 cases (ptrend < 0.01) (Table II, Figure 7).
Table II
Incidence of takotsubo cardiomyopathy among COVID-19 patients

Trends in all-cause mortality among COVID-19 patients
We found that the overall mortality rate of COVID-19 adults followed a decreasing trend from April 2020 (16.74%) to April 2021 (6.96%). However, from April 2021 to December 2021, the number of hospital deaths rose to reach 13.98% (Table I, Figure 8, ptrend < 0.01).
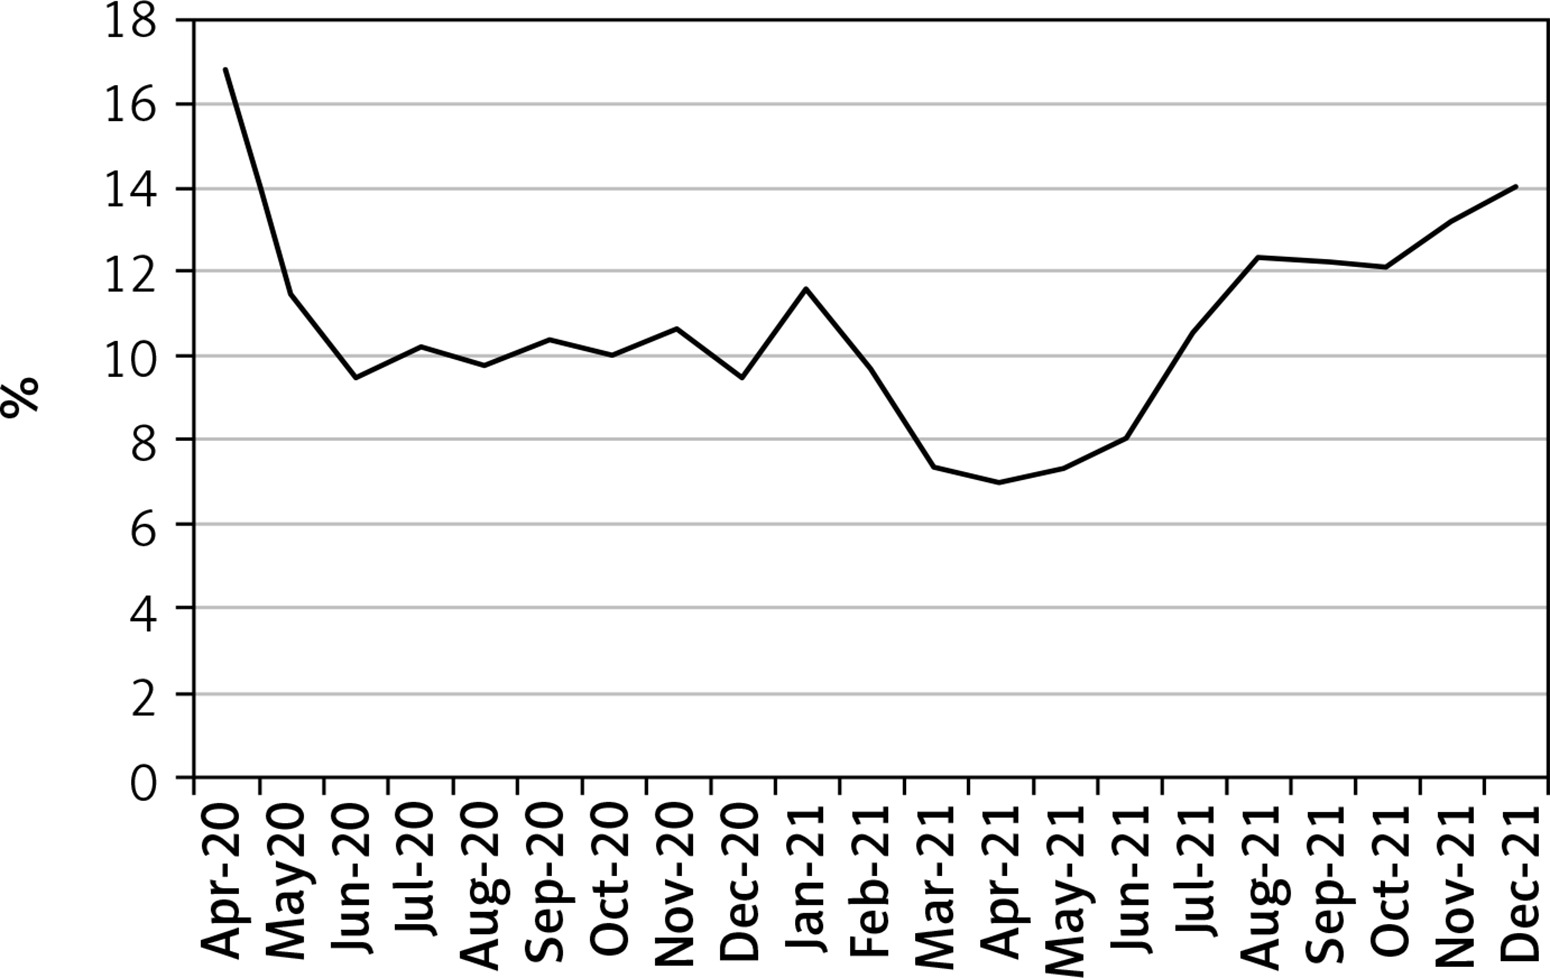
The overall mortality rate was 10.92% in 2020 and 11.33% in 2021 (p < 0.01).
Discussion
Our results include several critical points that improve our understanding of the trends of several complications in COVID-19 patients during the 21 months of the pandemic in our study (April 2020-December 2021). The peak number of hospitalizations seen in January 2021 correlates with the data released by the CDC for all confirmed cases of COVID-19 for the United States [25, 26]. Similarly, we also confirmed the peak seen in August 2021 in both studies. The data from the CDC however indicated the highest number of hospitalized cases during the week of January 15th 2022. We therefore encourage the expansion of our study when the HCUP releases the NIS 2022 in the future.
While our highest mortality was seen in April 2020, the CDC reported their highest rate in January 2021. This difference could be related to the number of deaths due to COVID-19 that took place outside of the hospitals, in emergency care units, and in centers not covered by the HCUP. The CDC data included any discharge ranks with U071 and did not include patients with a diagnosis code of J1282 (Pneumonia due to coronavirus disease 2019). Therefore, our results provide a hospitalization-based perspective on the mortality rates. In addition, HCUP data do not allow users to find the cause of death of the patients. We therefore encourage additional studies, with other databases, taking into account the main cause of deaths in COVID-19 hospitalizations during the pandemic [23, 27].
We also noted rising trends in events of APE and DVT, which followed similar patterns until November 2021. COVID-19 can activate various coagulation pathways, and the impact and severity can vary based on the SARS-CoV-2 variants. Our data do not include information about the viral subtype that the patients were infected with.
There were several drops in the incidence of several complications such as APE (May-June 2021), DVT (May-July 2021), AIS (February-July 2021), cardiac arrest (January-June 2021), which could hint at the protective roles of vaccines, which were introduced in December 2020, and the presence of variants with weaker coagulopathy effects and varying impact on the cardiovascular system. In addition, the drop seen in APE and AIS after November 2021 coincides with the appearance of the Omicron variant [28], which had weaker pathogenicity [29].
Our study also showed a sudden rise in myocarditis from March to June 2021, which subsequently dropped. In 2021, before the arrival of the Delta variant, the Alpha strain was believed to be responsible for 66% of all COVID-19 cases during that time. The Alpha variant also has a higher risk of complications (including myocarditis) than subsequent variants (e.g. Omicron) [28, 30]. Further studies on the roles of all the variants during that time and their subsequent virulence and impact on the myocardial tissues will help improve our understanding of this trend.
There are several limitations to our study as we are unable to monitor for the changes in symptoms, the radiographic changes seen across the various months of the pandemic, and the subset of the virus among the patients. An expansion of our findings with the collaboration of other hospitals can subsequently help strengthen our knowledge on this issue.
In conclusion, we found several changes in the number of COVID-19 cases between April 2020 and December 2021, with a peak number recorded in January 2021. Moreover, several fluctuations were seen for events of APE, AIS, myocarditis, DVT, TC, and mortality. The roles of the virulence and pathogenicity of the variants involved could not be studied from our database.