Introduction
Dyslipidemia, defined as abnormalities in serum lipid levels including elevated total cholesterol (TC), triglycerides (TG), and low-density lipoprotein cholesterol (LDL-C), or reduced high-density lipoprotein cholesterol (HDL-C), is a major modifiable risk factor for cardiovascular diseases (CVDs) [1]. Although classically associated with middle-aged and elderly populations, recent evidence highlights its rising prevalence among younger adults and even adolescents [2]. This trend is particularly concerning, as early lipid abnormalities often remain asymptomatic for years before manifesting clinically as cardiovascular complications.
University students constitute a vulnerable demographic due to lifestyle transitions and behavioral risk factors, such as irregular dietary habits, sedentary behavior, academic stress, and disrupted sleep patterns. In Saudi Arabia, studies have demonstrated an alarming burden of dyslipidemia among university-aged populations. For example, a study among Taif University health sciences students reported a prevalence of 60%, with low HDL-C being the most frequent abnormality, and significant associations with sedentary behavior and higher body mass index (BMI) [3]. Similarly, the Jeeluna national survey found that one in four Saudi adolescents exhibited dyslipidemia, with higher rates in males compared to females [4].
Cardiovascular disease (CVD) remains the leading cause of morbidity and mortality worldwide, and atherosclerotic risk begins accumulating silently from early life. Although screening for dyslipidemia is traditionally focused on older or overweight adults, growing evidence suggests that lipid abnormalities may be prevalent even among young, non-obese populations. BMI is often used as a first-line indicator of metabolic risk, yet it may fail to identify individuals with normal weight but abnormal lipid profiles, referred to as “metabolically obese normal-weight” (MONW) individuals.
In this context, lipid ratios such as the Atherogenic Index of Plasma (AIP) and the total cholesterol to HDL-C (TC/HDL) ratio are gaining recognition as more sensitive indicators of early cardiovascular risk. These indices integrate multiple lipid components and may outperform BMI in predicting subclinical atherogenic burden, especially in younger populations.
Broader lifestyle factors in the Saudi population, such as increased fast-food consumption, physical inactivity, and rising obesity, further compound this risk [5]. Comparable studies among medical students in neighboring regions, such as Pakistan, have also revealed unhealthy eating patterns and stress-related behaviors that contribute to dyslipidemia [6]. Together, these findings highlight the urgent need to evaluate lipid abnormalities in student populations and to identify key lifestyle predictors of risk.
Traditional lipid markers may fail to detect subtle early metabolic disturbances, especially in individuals with normal body weight. Novel indices such as the AIP and lipid ratios (e.g., TC/HDL-C) integrate multiple lipid parameters, providing a more sensitive measure of atherogenic risk. These markers have shown superior predictive value for cardiovascular events and metabolic disorders in diverse populations.
The current study, therefore, seeks to address this gap by investigating the prevalence of dyslipidemia among students at an Islamic university in Saudi Arabia and examining its association with lifestyle behaviors, including diet and physical activity. Importantly, the study evaluates whether novel lipid-based markers such as the AIP and lipid ratios (e.g., TC/HDL) offer improved sensitivity over conventional measures like BMI in detecting early dyslipidemia. This approach aims to inform more effective screening and prevention strategies in young adult populations.
Material and methods
Study design and setting
This is a cross-sectional study designed to determine the prevalence of dyslipidemia and its association with lifestyle and sociodemographic factors among students at the Islamic University in Madinah, Saudi Arabia. Data collection was carried out at the Islamic University Medical Center between November 2024 and January 2025.
Study population
Participants included male students aged 20–30 years from various faculties. To reflect the diversity of the student body, the study included both Saudi nationals and international students. This allowed for comparisons of lifestyle factors and dyslipidemia prevalence between different cultural backgrounds.
Sample size and sampling
The sample size was calculated using an expected prevalence of dyslipidemia of ~30% among Saudi youth [3, 4]. With a 95% confidence level and a 5% margin of error, the minimum required sample was 200 students. To account for potential non-response and subgroup comparisons (Saudi vs. non-Saudi), we targeted 150 participants. A stratified random sampling method was used to ensure representativeness across faculties, genders, and nationalities.
Data collection
1. Biochemical assessment
Fasting blood samples were obtained after 8–12 h of overnight fasting.
Lipid profile parameters measured:
Analysis was conducted in a certified laboratory using automated enzymatic assays.
2. Lifestyle and sociodemographic questionnaire
A validated self-administered questionnaire captured:
Sociodemographic data: age, nationality (Saudi vs. non-Saudi), faculty, academic year.
Dietary habits: frequency of fruit, vegetables, fast food, and sugary drink consumption.
The questionnaire was piloted among 20 students for clarity and reliability prior to administration.
Classification of lifestyle was based on two components: regular physical activity and nutritional quality of the diet. Students who reported regular exercise and generally good dietary quality were categorized as having a healthy lifestyle, while those reporting no exercise and frequent fast-food consumption were classified as having an unhealthy lifestyle.
3. Anthropometric measurements
Outcome definition
Dyslipidemia was defined according to the NCEP-ATP III criteria [7]: TC ≥ 200 mg/dl, LDL-C ≥ 130 mg/dl, HDL-C < 40 mg/dl (men) or < 50 mg/dl (women), TG ≥ 150 mg/dl.
A participant was considered to have dyslipidemia if any one of these abnormalities was present.
Statistical analysis
Descriptive statistics:
Continuous variables: mean ± standard deviation (SD).
Categorical variables: frequency and percentages.
Prevalence of dyslipidemia was reported overall and stratified by age and nationality (Saudi vs. non-Saudi).
Comparative analysis:
Multivariate analysis
To explore independent predictors of dyslipidemia, we will apply:
Binary logistic regression: to estimate odds ratios (ORs) for dyslipidemia by nationality, lifestyle factors, BMI, and stress, adjusting for confounders.
Interaction terms: nationality × diet→ to test whether lifestyle effects differ by nationality.
Multinomial logistic regression: to explore predictors of different dyslipidemia types (isolated low HDL-C, hypertriglyceridemia, mixed dyslipidemia).
ROC curve analysis: to evaluate predictive performance of BMI and waist circumference for abnormal lipid profiles.
Stratified analysis by nationality: to uncover culturally driven differences in risk profiles (e.g., diet patterns in Saudi vs. international students).
All analyses will be performed using SPSS version 26 (IBM Corp., Armonk, NY, USA). A p-value < 0.05 will be considered statistically significant.
Results
Participant characteristics
A total of 150 male students were analyzed (Table I). The mean age was 22.8 ±2.0 years and mean BMI 25.3 ±4.0 kg/m². Nationality distribution was predominantly Non-Saudi (94.0%), with Saudis comprising 6.0%. Reported lifestyle was Healthy in 64.7% and Unhealthy in 34.7% of students.
Table I
Baseline characteristics of study participants
Lipid profile and prevalence of abnormalities
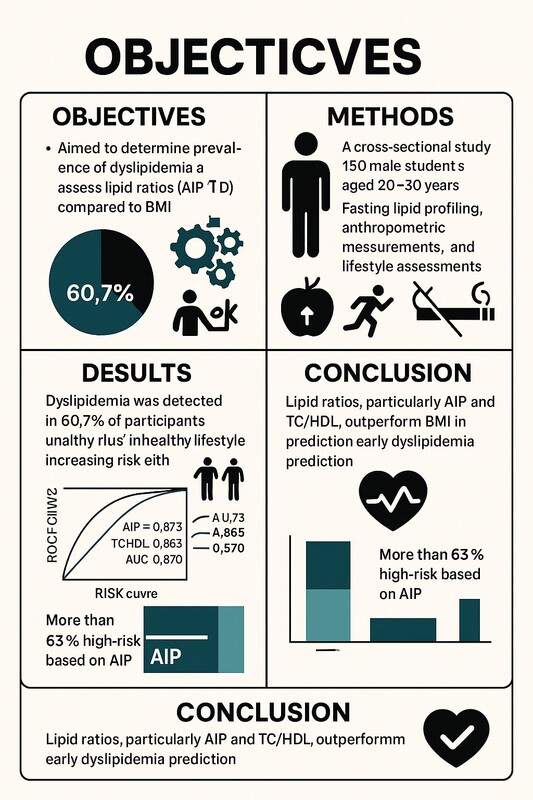
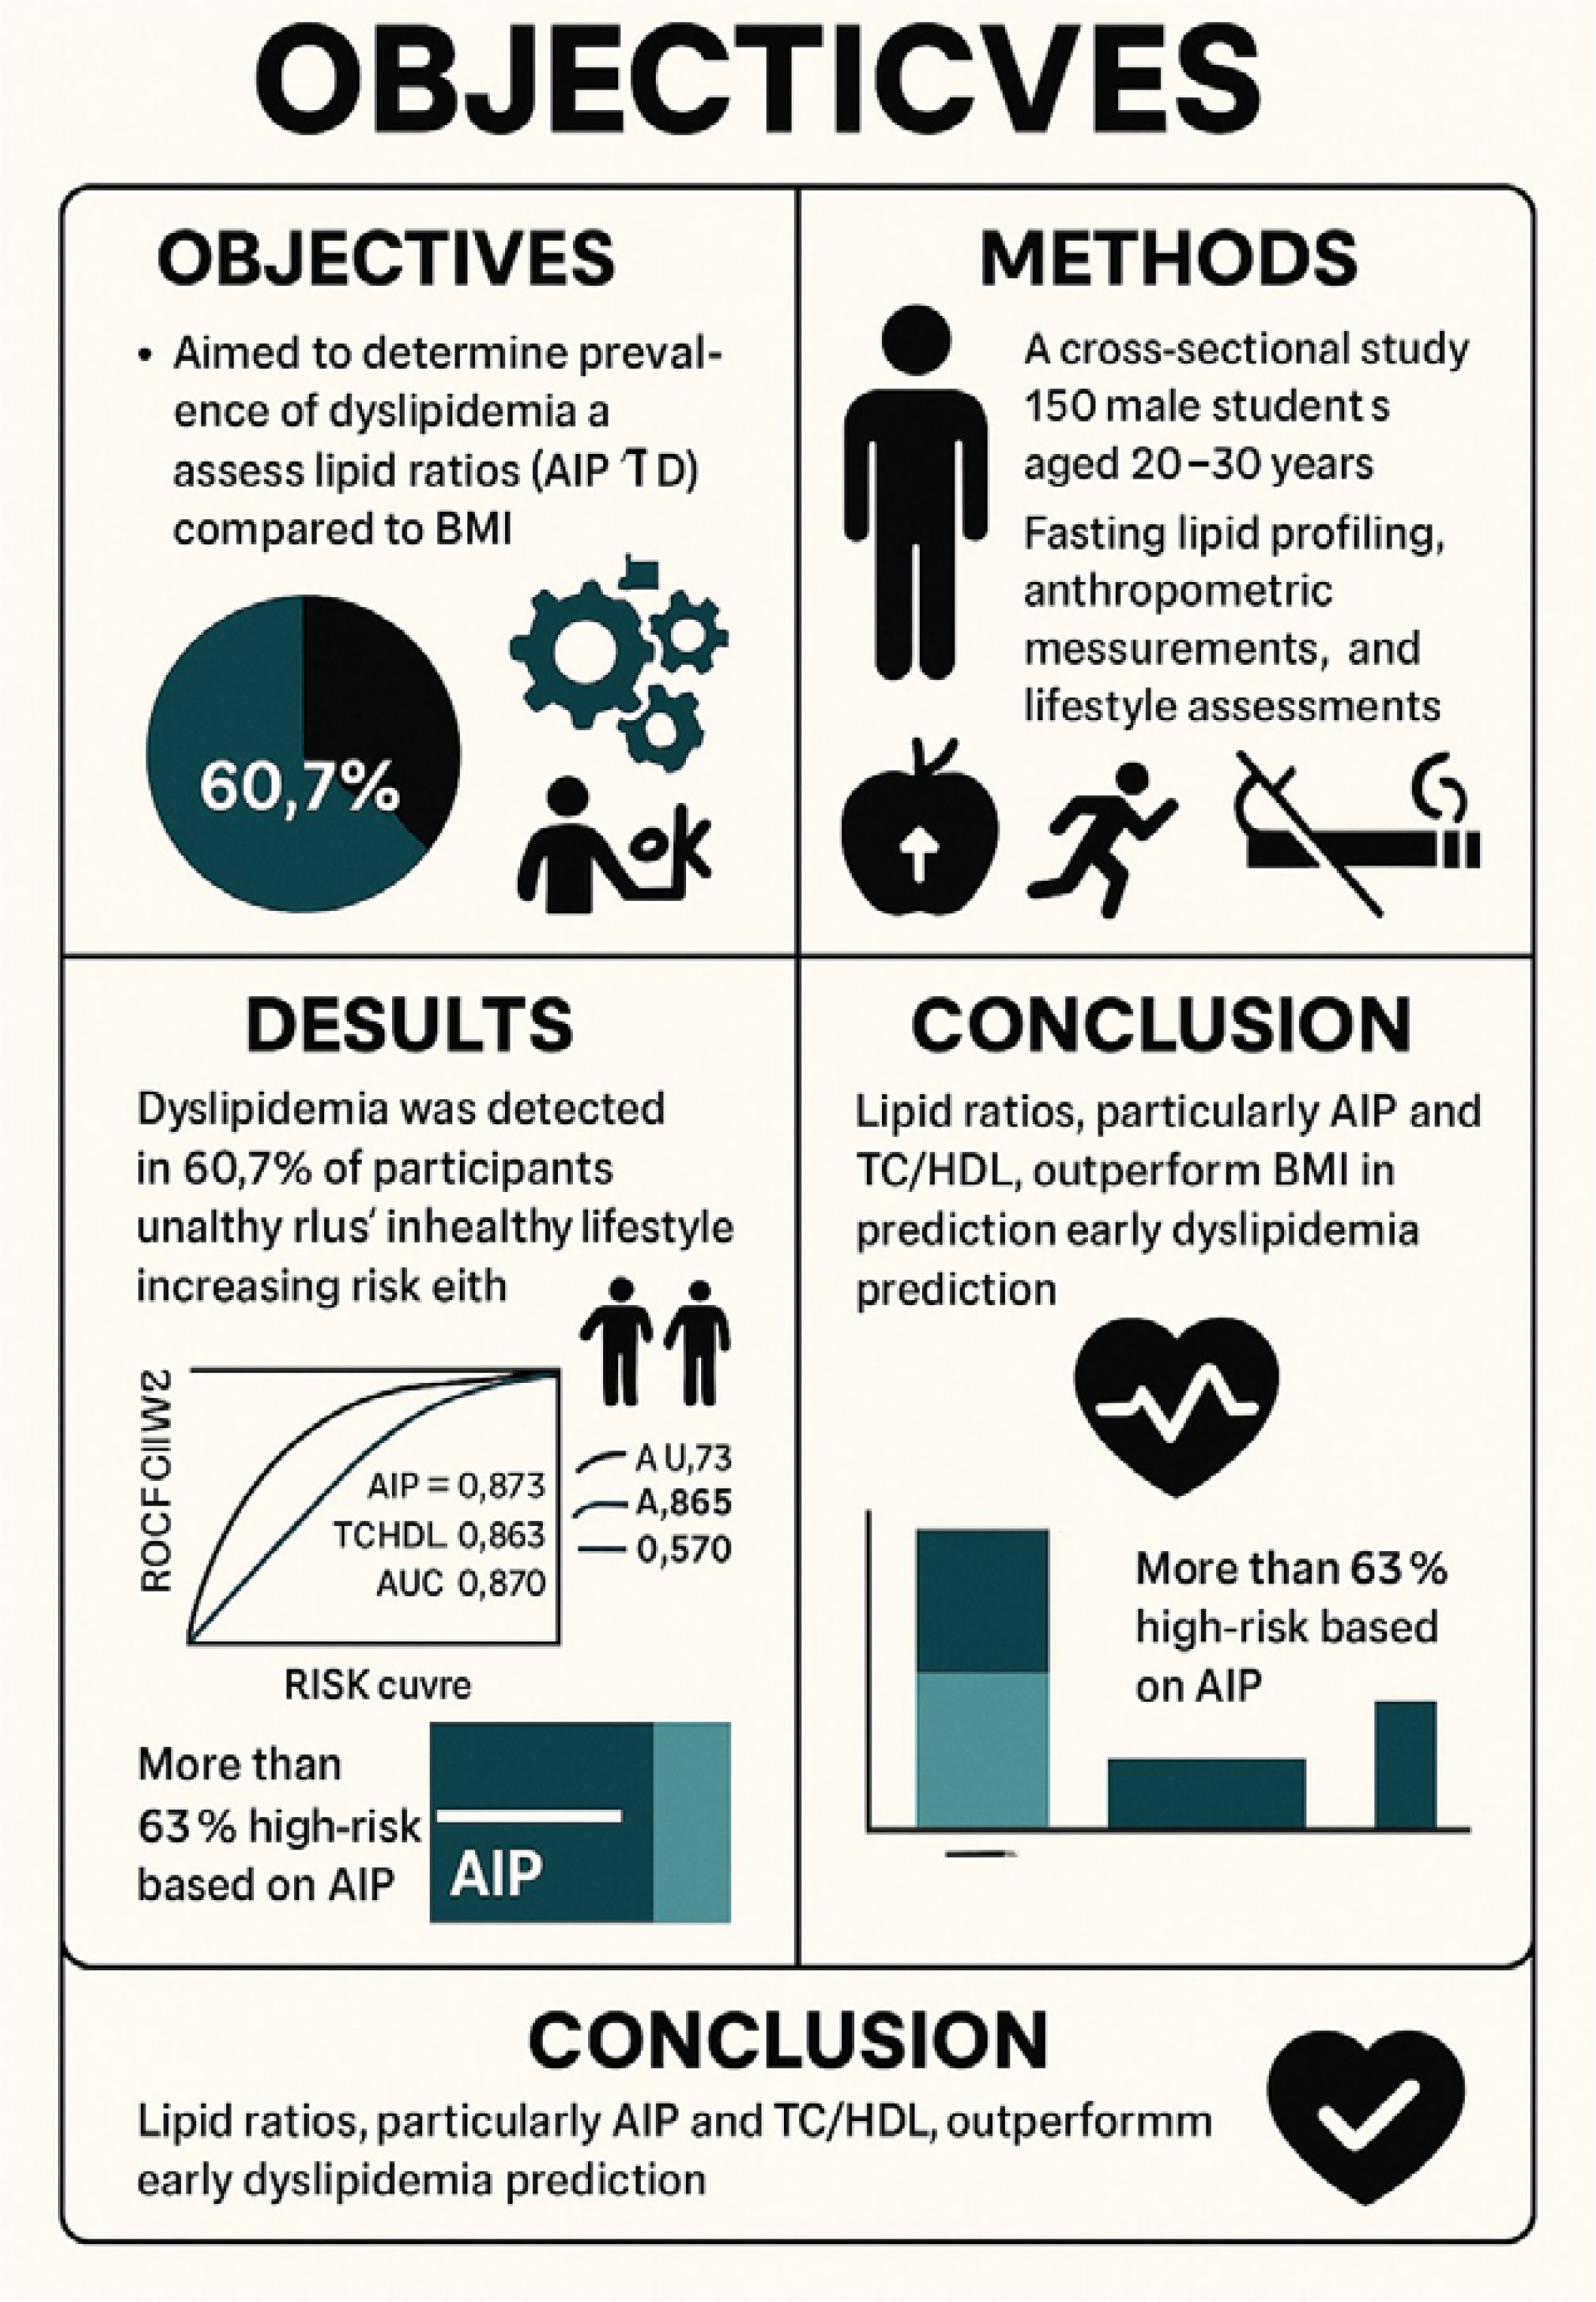
Mean lipid values were TC 190.8 (±37.1) mg/dl, LDL-C 119.5 (±33.7) mg/dl, HDL-C 49.4 (±10.6) mg/dl, and TG 117.0 (±67.1) mg/dl (Table II). The prevalence of abnormalities was: high TC 37.3%, high LDL-C 36.0%, low HDL-C 22.0%, high TG 30.0%, and any dyslipidemia 60.7% (Table II).
Lifestyle differences
Unhealthy lifestyle was strongly associated with lipid abnormalities (Table III A). Any dyslipidemia was present in 86.5% of Unhealthy students versus 46.4% of Healthy students (p < 0.00001). High TG and high TC showed the largest differences. Figure 1 illustrates these differences graphically.
Table III
Lipid abnormalities by lifestyle category (A), nationality (B)
| A | ||||||
|---|---|---|---|---|---|---|
| Lifestyle | N | High TC (%) | High LDL (%) | Low HDL (%) | High TG (%) | Any dyslipidemia (%) |
| Healthy | 97.0 | 25.8 | 27.8 | 23.7 | 13.4 | 46.4 |
| Unhealthy | 52.0 | 57.7 | 50.0 | 19.2 | 61.5 | 86.5 |
National differences
Prevalence of any dyslipidemia was 66.7% in Saudis (n = 9) vs. 60.3% in Non-Saudis (n = 141), with no statistically significant difference (p = 0.978). Detailed lipid abnormalities by nationality are shown in Table III B.
BMI and dyslipidemia
Dyslipidemia prevalence increased across BMI categories (Normal 58.9%, Overweight 63.0%, Obese 65.0%), but the trend was not statistically significant (p = 0.727). Mean BMI was slightly higher in dyslipidemic versus non-dyslipidemic students (25.7 vs. 24.6 kg/m², p = 0.089, Data not shown).
Multivariable predictors
In logistic regression adjusting for age, BMI, nationality, and lifestyle (Table IV), Unhealthy lifestyle increased the odds of dyslipidemia by ~8-fold (OR = 8.30, 95% CI: 3.32–20.71, p < 0.001). Each 1 kg/m² increase in BMI added 11% higher odds (OR = 1.11, 95% CI: 1.01–1.21, p = 0.035). Age and nationality were not significant predictors.
Table IV
Logistic regression predicting any dyslipidemia
| Variable | OR | CI_lower | CI_upper | P-value |
|---|---|---|---|---|
| Const | 2.74 | 0.03 | 289.16 | 0.67 |
| Age | 0.85 | 0.7 | 1.03 | 0.09 |
| BMI | 1.11 | 1.01 | 1.21 | 0.03 |
| Unhealthy | 8.3 | 3.32 | 20.71 | 0.0 |
| Saudi | 1.24 | 0.27 | 5.68 | 0.78 |
Atherogenic indices revealed additional burden (Tables V A and V B): non-HDL-C ≥ 160 mg/dl in 28.7%, TC/HDL-C > 5 in 18.0%, and TG/HDL-C > 3.5 in 21.3%. The atherogenic dyslipidemia phenotype (TG ≥ 150 mg/dl with HDL-C < 40 mg/dl) was present in 12.0%. BMI showed poor discrimination for dyslipidemia (AUC = 0.57), with optimal cut-off ~21 kg/m² yielding high sensitivity (> 0.95) but low specificity. Cluster analysis of lipid profiles identified three distinct phenotypes: Cluster 0: favorable (low TG/LDL, high HDL); Cluster 1: low HDL with moderate TG; and Cluster 2: LDL–TG dominant (very high TC/LDL and TG, 100% dyslipidemia). Unhealthy lifestyle was overrepresented in Cluster 2 (56%).
Table V
A – Logistic regression for high TG (BMI + Lifestyle). B – Logistic regression for high TG with interaction (BMI × Unhealthy)
| A | ||||
|---|---|---|---|---|
| Variable | OR | CI_lower | CI_upper | P-value |
| Const | 0.262 | 0.017 | 4.081 | 0.33 |
| BMI | 0.979 | 0.88 | 1.09 | 0.70 |
| Unhealthy | 10.269 | 4.573 | 23.058 | 0.0 |
Lipid ratios and AIP
To assess residual cardiovascular risk, lipid ratios and the AIP were calculated. Overall means (±SD) were: AIP 0.34 ± 0.27, TC/HDL ratio 4.00 ±1.09, LDL/HDL ratio 2.58 ±0.94, and TG/HDL ratio 2.53 ±1.87. Risk stratification by AIP showed that 26.0% were low risk, 10.7% intermediate, and 63.3% high risk (Table VI).
Table VI
Lipid ratios and AIP by lifestyle category (mean ± SD)
| Lifestyle | AIP (log10[TG/HDL]) | TC/HDL ratio | LDL/HDL ratio | TG/HDL ratio |
|---|---|---|---|---|
| Healthy | 0.25 ±0.23 | 3.85 ±1.00 | 2.58 ±0.91 | 2.00 ±1.47 |
| Unhealthy | 0.52 ±0.24 | 4.26 ±1.18 | 2.61 ±1.00 | 3.56 ±2.12 |
| P-value | < 0.001 | 0.023 | 0.879 | < 0.001 |
Unhealthy students had significantly higher AIP and TG/HDL ratios compared with Healthy students (both p < 0.001), and modestly higher TC/HDL ratio (p = 0.023). LDL/HDL ratio did not differ by lifestyle (Data not shown). These findings clearly demonstrate that AIP and TC/HDL ratio offer superior discriminative power over BMI for early dyslipidemia detection in student populations.
Discussion
This study demonstrates that lipid ratios particularly AIP and TC/HDL are more effective than BMI in detecting early dyslipidemia among university students. Although the mean BMI was within the normal range, more than 60% of students showed at least one lipid abnormality, underscoring the limited value of anthropometric measures alone. AIP and TC/HDL displayed excellent predictive performance (AUC > 0.86), whereas BMI showed poor discrimination (AUC = 0.57), supporting the superiority of lipid-based indices for early cardiometabolic risk detection.
Lifestyle factors also played a substantial role. Students with unhealthy habits, physical inactivity and frequent fast-food consumption, had markedly higher odds of dyslipidemia. These findings align with regional studies reporting adverse lipid profiles among young adults with sedentary and high-calorie dietary patterns and suggest that triglyceride metabolism and impaired HDL function may be early pathways underpinning this risk.
Cluster analysis further highlighted distinct lipid phenotypes, including an LDL–TG dominant profile in which all students exhibited dyslipidemia. This pattern is consistent with previous reports linking lipid clustering to cardiometabolic risk. In contrast, the favorable cluster was characterized by higher HDL and lower TG, reinforcing the protective role of preserved HDL function.
Subgroup patterns indicated a slightly higher prevalence of dyslipidemia in older students and Saudis, reflecting known associations with age and cultural dietary trends. Although overweight and obesity contributed to higher prevalence, BMI remained less informative than biochemical indices, consistent with regional evidence.
Overall, these results indicate that BMI and routine lipid cutoffs may fail to identify many at-risk young adults. Incorporating lipid ratios such as AIP and TC/HDL into student health screenings could improve early detection and enable more targeted lifestyle interventions.
This study has limitations, including its cross-sectional design and modest sample size with small Saudi participant numbers. The small Saudi subgroup warrants cautious interpretation, though it provides preliminary insights into cultural influences on lipid profiles. The male-only sample limits generalizability but improved internal validity by minimizing hormonal variability. Strengths include comprehensive biochemical profiling, the application of ROC and cluster analyses, and the focus on an understudied population. Future research should involve larger, gender-balanced cohorts, longitudinal follow-up, and additional metabolic markers to build a broader understanding of early cardiometabolic risk [8–16].
In conclusion, this study suggests a relatively high prevalence of dyslipidemia among young male university students, with more than 60% showing at least one lipid abnormality despite an average BMI within the normal range. These observations underscore the limitations of relying solely on anthropometric measures such as BMI to assess early metabolic risk in this population. In this cohort, the AIP and TC/HDL ratio showed stronger discriminative ability than BMI, indicating that lipid ratios may offer additional value in identifying early lipid abnormalities.
Unhealthy lifestyle behaviors were associated with markedly higher odds of dyslipidemia, and lipid-based indices appeared more sensitive to these differences than traditional anthropometric measures. These findings highlight the potential utility of lipid ratios for risk stratification in research and clinical contexts, although larger and more diverse studies are needed before drawing firm conclusions.
While the results are preliminary, they contribute to the growing evidence that metabolic risk may be underrecognized in young adults with normal BMI. Future research involving broader populations, longitudinal designs, and additional metabolic markers will be essential to confirm these associations and clarify their implications for early prevention strategies.