Introduction
Lipoprotein(a) [Lp(a)] is a low-density lipoprotein (LDL) particle in which apolipoprotein B (ApoB) is covalently bound to apo(a) [1]. Evidence from experimental, observational, and genetic studies has established the association between elevated Lp(a) levels and atherosclerotic cardiovascular disease (ASCVD) [1–11]. The threshold for elevated Lp(a) levels is set at > 30 mg/dl (> 75 nmol/l) [10]. Of note, almost 20% of the general population has Lp(a) > 50 mg/dl (> 125 nmol/l) [10]. According to the 2018 AHA/ACC/AACVPR/AAPA/ABC/ACPM/ADA/AGS/APhA/ASPC/NLA/PCNA Guideline on the Management of Blood Cholesterol [12], Lp(a) levels ≥ 50 mg/dl or ≥ 125 nmol/l may be considered a risk-enhancing factor; thus Lp(a) assessment can help to identify individuals at high ASCVD risk.
Currently, there is no approved Lp(a)-lowering treatment [13]. Controversial results have been reported regarding the effect of hypolipidemic treatment on Lp(a) levels [14–18]. Statins and fibrates tend to increase Lp(a) levels [14, 18], omega-3 fatty acids have a neutral effect [19], ezetimibe seems to have a beneficial effect [20], while niacin, although it lowers Lp(a) levels [21], is not available on the European market.
In an open-label study, we randomized 90 patients with mixed hyperlipidemia (LDL-C > 160 and triglycerides > 200 mg/dl) to either rosuvastatin 40 mg/day (R group) or rosuvastatin 10 mg/day with micronized fenofibrate 200 mg/day (RF group) or omega-3 fatty acids 2 g/day (RΩ group) [22]. High-dose rosuvastatin monotherapy was the most effective regimen in reducing LDL-C and non-high-density lipoprotein-cholesterol (non-HDL-C), while the RF combination was best at decreasing triglycerides and raising HDL-C levels [22]. All regimens significantly reduced total plasma lipoprotein-associated phospholipase A2 (Lp-PLA2), but R and RF were more effective compared with RΩ [23]. When analyzing the subgroup of mixed hyperlipidemic patients with metabolic syndrome (MetS), we observed a greater increase in mean LDL size in the RF group compared with the R and RΩ groups [24].
The present work is a post-hoc analysis that includes patients from a previously published study [22], whose Lp(a) levels were assessed. We assessed the effects of rosuvastatin-based regimens on Lp(a) levels.
Material and methods
Study population
As previously described, patients with LDL-C > 160 mg/dl (4.2 mmol/l) and triglycerides > 200 mg/dl (2.3 mmol/l) on two consecutive visits, attending the Outpatient Lipid Clinic of the University Hospital of Ioannina, Greece, were recruited [22–24]. Exclusion criteria were: (i) established ASCVD, (ii) triglyceride levels > 500 mg/dl (5.6 mmol/l), (iii) renal disease (defined as serum creatinine levels > 1.6 mg/dl [141 µmol/l]), (iv) diabetes mellitus (fasting blood glucose > 126 mg/dl [7.0 mmol/l]), (v) hypothyroidism (thyroid stimulating hormone > 5 IU/ml), (vi) liver disease (alanine and/or aspartate aminotransferase [ALT/AST] activities > 3-fold upper limit of normal (ULN) on more than two consecutive measurements), (vii) any medical condition that might preclude successful completion of the study protocol, (viii) active hypolipidemic treatment during the last 4 weeks before study entry and (ix) hypertensive patients with any change in antihypertensive medications during the study period.
Patients were allocated to open-label rosuvastatin 40 mg (n = 30, group R), rosuvastatin 10 mg plus fenofibrate 200 mg (n = 30, group RF) or rosuvastatin 10 mg plus 2 g of omega-3 fatty acids (each gram of the preparation contained approximately 465 mg of eicosapentaenoic acid [EPA] and 375 mg of docosahexaenoic acid [DHA]) (n = 30, group RΩ) daily.
All participants gave their informed consent and the study protocol was approved by the institutional ethics committee.
Biochemical parameters
Anthropometric variables and serum metabolic parameters were assessed at baseline and after 3 months of treatment. All laboratory determinations were carried out after an overnight fast. LDL-C was calculated using the Friedewald formula (provided that triglycerides were < 400 mg/dl). Serum concentrations of total cholesterol (TC) and triglycerides were determined enzymatically on an Olympus AU600 clinical chemistry analyzer (Olympus Diagnostica, Hamburg, Germany). HDL-C was determined in the supernatant, after precipitation of the apolipoprotein B-containing lipoproteins with dextran sulphate-Mg++ (Sigma Diagnostics, St. Louis, MO, USA). Non-HDL-C was calculated by the equation: non-HDL-C = TC – HDL-C. Serum apolipoproteins (Apo) A-I and B and Lp(a) were measured by immunonephelometry on a BN ProSpec nephelometer (Dade-Behring, Lieberbach, Germany).
Statistical analysis
Values are given as mean ± standard deviation (SD) and median (range) for parametric and non-parametric data, respectively. Continuous variables were tested for lack of normality by the Shapiro-Wilk test (number of patients < 50) and logarithmic transformations were accordingly performed for triglycerides, and Lp(a). The paired-samples t-test was used for assessing the effect of treatment in each group (or Wilcoxon’s rank test for non-parametric data). Analysis of covariance (ANCOVA), adjusted for baseline values, was used for comparisons between treatment groups. Relationships of posttreatment change in the Lp(a) levels with baseline age, gender, waist circumference, body mass index (BMI), lipids and apo levels as well as correlations between changes in Lp(a) levels and those in serum lipid concentrations were assessed using Spearman’s correlation coefficients. Significance was defined as p < 0.05. Analyses were performed using SPSS 29.0 (IBM SPSS Statistics for Windows, Version 29.0. Armonk, NY: IBM Corp).
Results
Demographic and clinical characteristics
The detailed baseline demographic and clinical characteristics of the total population are described elsewhere [22]. From all patients recruited in this study, we had data on Lp(a) levels for 16/30 in the R group (53.3%), 16/30 in the RF group (53.3%) and 15/30 in the RΩ group (50.00%). The demographic and clinical characteristics of these patients are shown in Table I. The groups were age- and sex-matched. No differences between groups in baseline clinical variables were noted.
Table 1
Baseline demographic characteristics of study patients
[i] Values are expressed as mean ± SD except for triglycerides, which are expressed as median (range). R – rosuvastatin, RF – rosuvastatin + fenofibrate, RΩ – rosuvastatin + omega-3 fatty acids, BMI – body mass index, TC – total cholesterol, HDL-C – high-density lipoprotein cholesterol, LDL-C – low-density lipoprotein cholesterol, non-HDL-C – non-high-density lipoprotein cholesterol, Apo – apolipoprotein, Lp(a) – lipoprotein(a), NS – non-significant.
Changes in serum lipoprotein, apolipoprotein and Lp(a) levels
The changes in serum lipid and apo levels in the substudy population are shown in Table II. Significant reductions in TC, LDL-C and non-HDL-C compared with baseline levels were noted in all groups. Regarding LDL-C, these changes were greater in the R compared with the RF and RΩ groups (p < 0.05 for the comparison). No significant difference was noted between the RF and RΩ groups. Triglyceride levels were significantly reduced in all groups. This decrease was significantly greater in the RF compared with the R (p < 0.001) and the RΩ (p = 0.031) groups. No significant alterations were noted in HDL-C and apoA1 levels. ApoB was significantly reduced to a similar extent in all treatment groups.
Table II
Changes in lipid variables in the substudy population
| Variable | R group (n = 16) | RF group (n = 16) | RΩ group (n = 15) | |||
|---|---|---|---|---|---|---|
| Baseline | Week 12 | Baseline | Week 12 | Baseline | Week 12 | |
| TC [mg/dl] | 303 ±66 | 172 ±37*** | 295 ±48 | 190 ±40*** | 286 ±40 | 189 ±37*** |
| Triglycerides [mg/dl] | 244 (201–384) | 177 (94–309)** | 291 (220–364) | 127 (67–215)***, b | 275 (201–395) | 159 (107–327)*** |
| HDL-C [mg/dl] | 50 ±7 | 49 ±9 | 52 ±11 | 56 ±13* | 49 ±11 | 50 ±11 |
| LDL-C [mg/dl] | 207 ±71 | 91 ±36***, a | 184 ±44 | 118 ±48*** | 183 ±37 | 106 ±31*** |
| Non-HDL-C [mg/dl] | 253 ±63 | 123 ±34*** | 243 ±39 | 133 ±35*** | 236 ±38 | 139 ±31*** |
| ApoA1 [mg/dl] | 149 ±21 | 145 ±22 | 163 ±25 | 169 ±29 | 147 ±25 | 147 ±27 |
| ApoB [mg/dl] | 139 ±33 | 75 ±23*** | 142 ±26 | 84 ±26*** | 134 ±20 | 84 ±22*** |
| Lp(a) [mg/dl] | 10.9 (2.44–48.80) | 13.7 (2.50–76.20)* | 7.07 (2.44–83.3) | 8.95 (2.44–86.60)* | 5.70 (2.44–24.30) | 6.0 (2.44–24.2) |
Values are expressed as mean ± SD except for triglycerides and Lp(a), which are expressed as median (range). R – rosuvastatin 40 mg, RF – rosuvastatin 10 mg plus fenofibrate 200 mg, RΩ – rosuvastatin 10 mg plus omega-3 fatty acids 2 g, TC – total cholesterol, HDL-C – high-density lipoprotein cholesterol, LDL-C – low-density lipoprotein cholesterol, non-HDL-C – non-high-density lipoprotein cholesterol, apo – apolipoprotein; Lp(a) – lipoprotein(a).
A significant increase in Lp(a) levels was noted in R (p = 0.017) and RF (p = 0.029) groups compared with baseline levels, while a non-significant difference was seen in the RΩ group (Figure 1).
Figure 1
Effect of hypolipidemic treatment on serum lipoprotein(a) concentrations
*p < 0.05 compared with baseline.
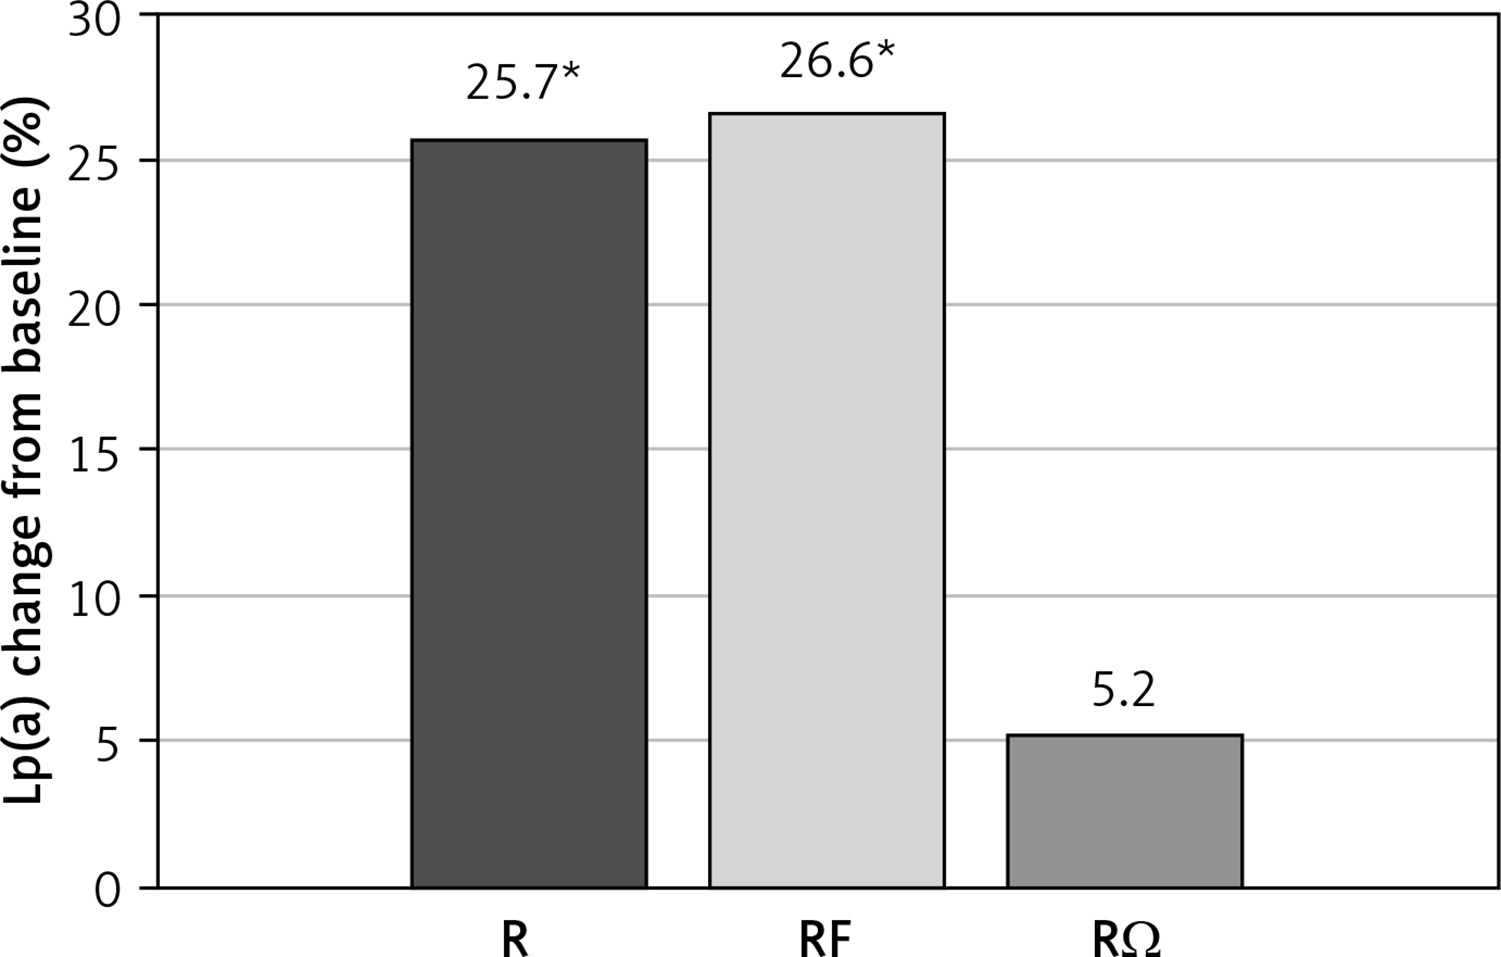
Regarding Lp(a), no significant differences were found between treatment groups. In the univariate analysis that was performed, the increase in Lp(a) levels was not associated with baseline age, gender, waist circumference, BMI, lipids or apo levels, in either treatment group. However, after performing a bivariate analysis, a significant negative correlation between Lp(a) increase and LDL-C decrease was observed in the R monotherapy group (r = –0.500, p = 0.049), while a significant negative correlation between Lp(a) increase and triglycerides decrease was noted in the RF group (r = –0.531, p = 0.034). No significant correlations were noted in the RΩ group.
Discussion
The present study is a post-hoc analysis of a previously published open-label randomized study in which 90 patients with mixed hyperlipidemia were randomized to either high-dosing (40 mg/day) rosuvastatin monotherapy or moderate dosing (10 mg/day) rosuvastatin combined with fenofibrate (200 mg/day) or omega-3 fatty acids (2g/day) [22]. The present analysis included 47 patients whose Lp(a) data were available. In these patients, R monotherapy was more efficacious in reducing LDL-C than moderate dosing of rosuvastatin combined with fenofibrate or omega-3 fatty acids. On the other hand, RF reduced triglyceride levels more than R monotherapy and RΩ and was the only treatment that significantly increased HDL-C levels. These effects on the serum lipid profile are consistent with our previous findings in the whole population consisting of patients with mixed hyperlipidemia [22, 23], as well as in the presence of MetS [24].
The present post-hoc analysis revealed that Lp(a) levels were significantly increased in both R and RF groups. Lp(a) levels are almost 90% genetically determined. Lp(a) inheritance follows an autosomal dominant pattern, and is mostly influenced by a single gene, the LPA gene, located on chromosome 6q23 [3]. Lp(a) levels double within the first year of life as the apo(a) gene reaches full expression between the first and second years of life. Of note, Lp(a) levels are minimally affected by diet, physical activity, and other environmental factors [1, 25]. In contrast, Lp(a) may be altered by stressful factors, such as infections, sepsis, and chronic inflammatory diseases [1, 11, 25].
In general, hypolipidemic agents have variable effects on Lp(a) levels. Several studies have produced controversial results on the effect of statins on Lp(a) levels. However, recent metanalyses supported that Lp(a) levels increase significantly in patients on statin therapy, especially with rosuvastatin [14, 16]. Fibrates tend to increase Lp(a) levels [18], omega-3 fatty acids demonstrate a neutral effect [19], ezetimibe seems to have a beneficial effect [20], while niacin, although it lowers Lp(a) levels [21], is no longer available on the European market due to its diabetogenic effects and shows no cardiovascular benefit as well [26].
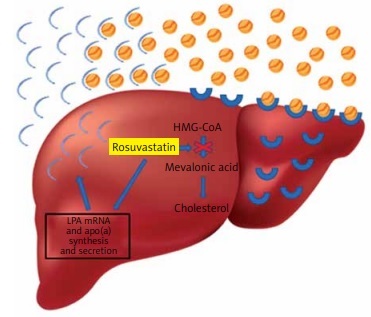
The underlying pathophysiological mechanisms by which statins affect Lp(a) levels are still under investigation. In the present study, the significant decrease in the concentrations of LDL-C induced by high doses of rosuvastatin could represent the major mechanism by which this regimen caused the increase in plasma Lp(a) levels in mixed hyperlipidemic patients. This is supported by the strong negative correlation observed between LDL-C decrease and Lp(a) increase in this patient group. In agreement with this assumption are the results of a recent meta-analysis, in which it was demonstrated that statins increase LPA mRNA and apolipoprotein(a) synthesis and secretion, suggesting that statin-induced increased production of apo(a) may lead to increased plasma levels of Lp(a) [14] (Figure 2). Another potential mechanism involving statin use with Lp(a) production could be the statin-induced elevation of plasma proprotein convertase subtilisin/kexin type 9 (PCSK9) levels [14]. It has been suggested that, although PCSK9 does not play a role in Lp(a) catabolism, it promotes the secretion of Lp(a) from liver cells [27]. Unfortunately, our study did not gather data on PCSK9 levels in the included mixed hyperlipidemic patients.
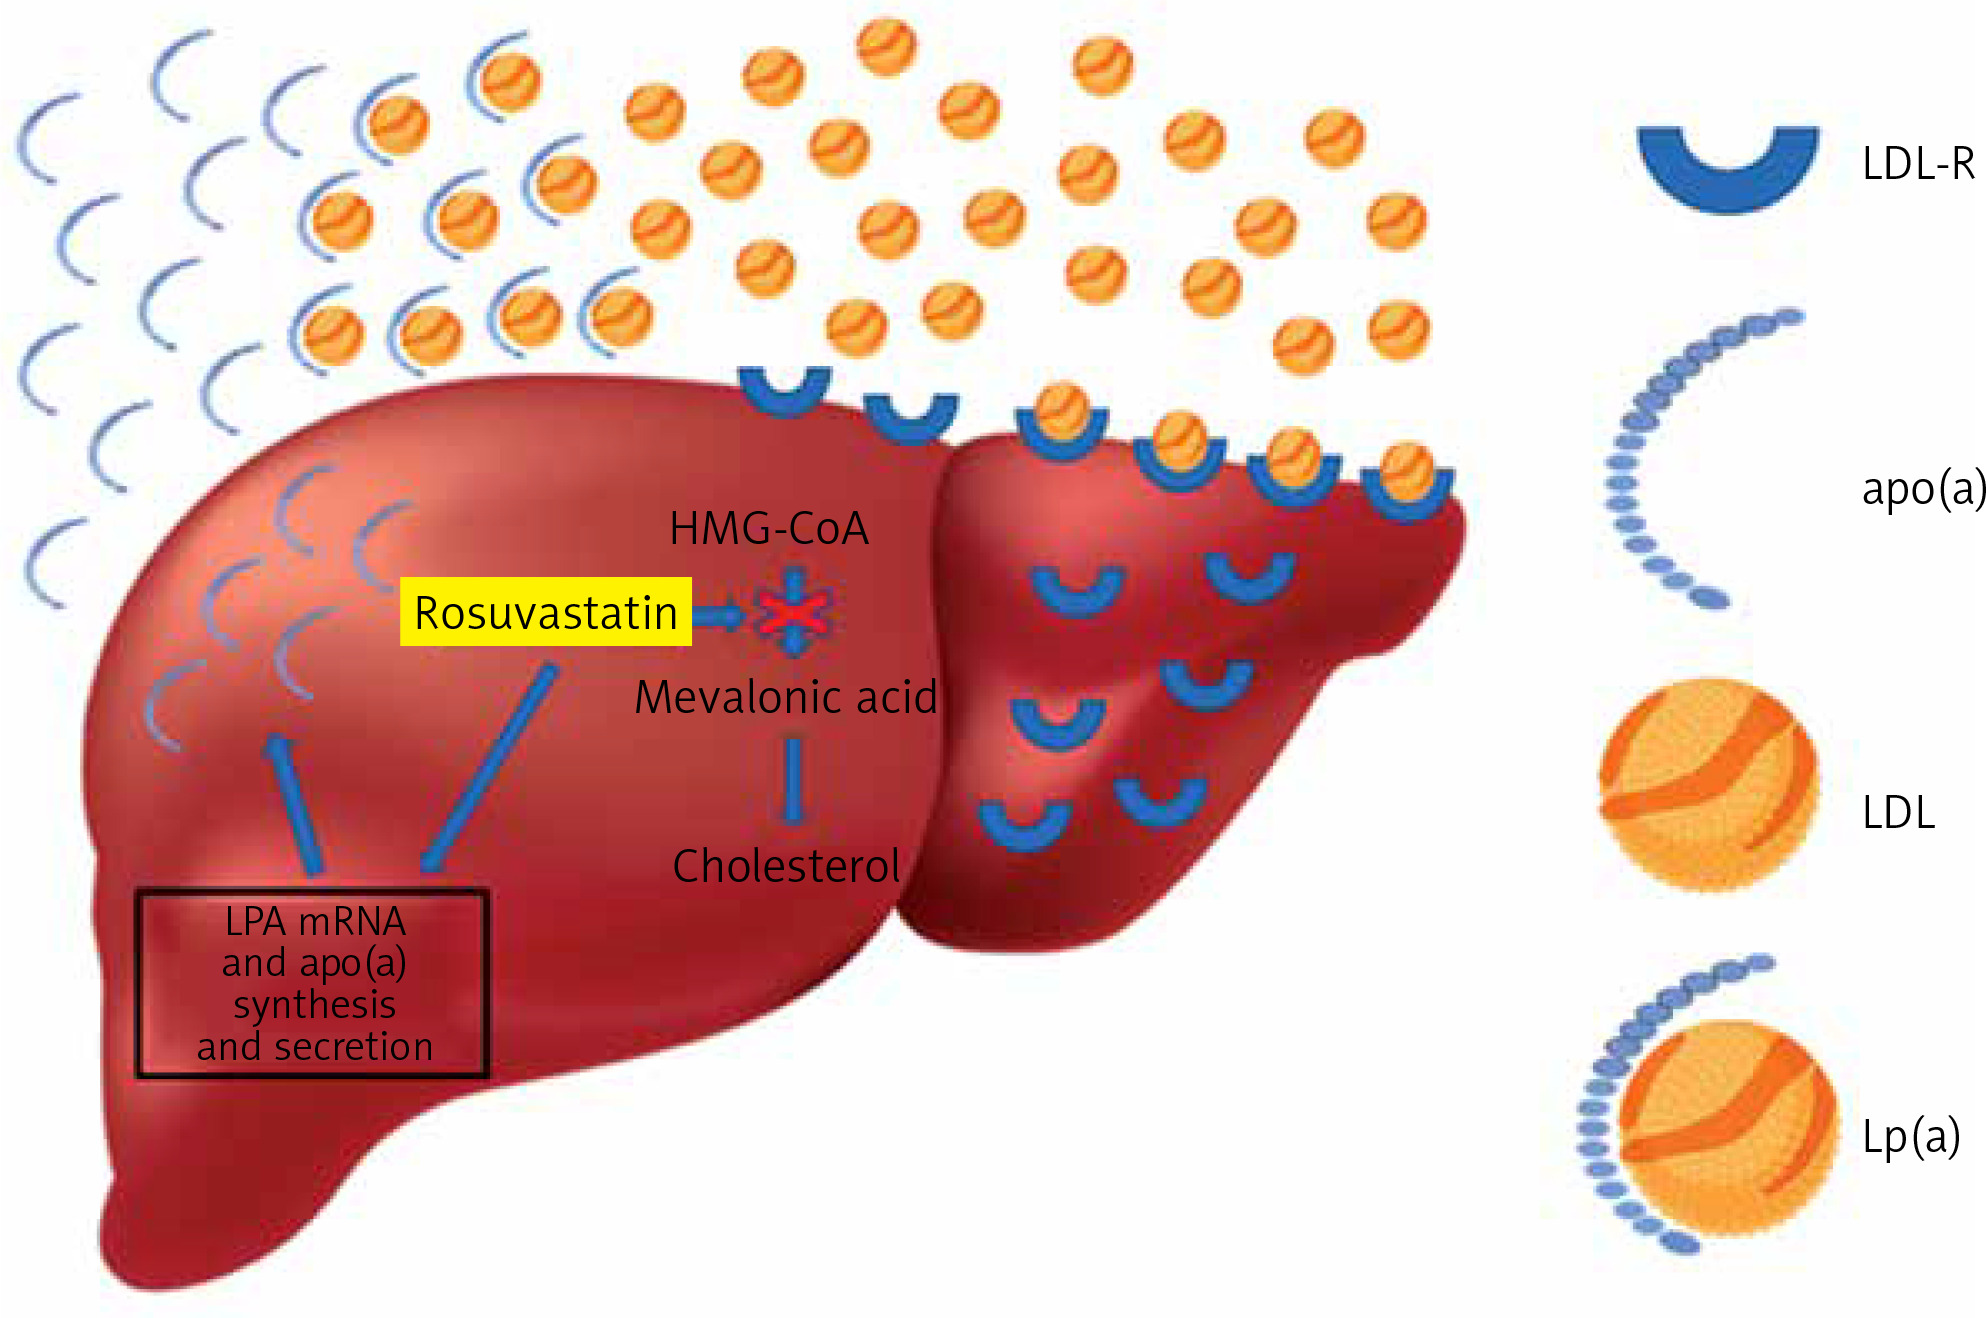
Figure 2
Rosuvastatin reduces hepatocyte cholesterol synthesis, which leads to the increase of LDL receptors, and as a result the uptake of circulating low-density lipoprotein (LDL) particles, leading to plasma LDL-C reduction. In contrast, rosuvastatin increases LPA mRNA and apolipoprotein(a) synthesis and secretion, resulting in an increase of plasma lipoprotein(a)
Fenofibrate seems to increase Lp(a) levels as well, an effect that can be attributed to the preferential reduction of triglycerides. One possible explanation for the relationship between Lp(a) and triglyceride levels is that Lp(a) is regulated by triglyceride. A high level of triglycerides may inhibit the synthesis of Lp(a), and the correction of hypertriglyceridemia by fenofibrate reverses this process. Indeed, a study on 56 hypertriglyceridemic patients on fenofibrate 200 mg/dl showed that the more triglyceride levels were decreased, the more Lp(a) levels were increased (r = –0.35, p = 0.008) [28]. Similarly, our results demonstrated a strong negative correlation between Lp(a) and triglyceride alterations in the rosuvastatin plus fenofibrate group. It is difficult to identify which component of the RF combination contributed more to the increase of Lp(a) levels. Thus, we may suggest that the rosuvastatin plus fenofibrate-induced elevation of Lp(a) levels by almost 26% reflects the combined effects of both moderate doses of rosuvastatin and fenofibrate.
A recent meta-analysis in patients with end-stage renal disease concluded that omega-3 fatty acids exhibit neutral effect on plasma Lp(a) levels [19]. In the present study, no significant difference of plasma Lp(a) levels was observed in the RΩ group, suggesting that omega-3 fatty acid supplementation was probably neutral, whereas rosuvastatin’s effects were probably dose dependent (non-significant difference with a moderate dose).
Trials of novel hypolipidemic agents have delivered promising results, as they exert beneficial effects on Lp(a) levels. More specifically, PCSK9 inhibitors are associated with a 20–30% decrease of Lp(a) levels [1]. Additionally, anti-sense oligonucleotides (ASOs) and small interfering RNAs (siRNAs) inhibiting hepatic apo(a) synthesis decrease Lp(a) levels by more than 90% [1, 29, 30]. The latter treatments are being investigated in cardiovascular outcome trials [1, 29, 30]. Moreover, monoclonal antibodies directed against IL-6 or its receptor [IL-6(R)i] reduced Lp(a) levels in rheumatoid arthritis patients [31, 32]. The main suggested mechanism of the above outcome is inhibition of the effect of IL-6 on the promoter region of the LPA gene, thus leading to decreased apo(a) production.
Limitations of this study include its post-hoc design and the small number of patients. As a retrospective post hoc analysis, no power analysis was performed for this specific endpoint. However, there is still some value in the analysis assessing the effects of standard treatments for dyslipidemia on emerging endpoints, whose value had not been established at the time of conducting this study. Moreover, the baseline values of Lp(a) were not identical in the three study groups. As a result, it may have influenced the mean differences between groups after 12 weeks of treatment, taking into account the small sample size. Although we tried to minimize the influence of these differences by using ANCOVA and considering the baseline values as covariates, a degree of statistical error may still exist.
In conclusion, after taking the above into consideration, and since Lp(a) represents an independent, causal, and measurable risk factor for ASCVD, future studies should evaluate whether statin-induced Lp(a) elevations contribute to residual ASCVD risk and whether there is a need for adding novel Lp(a)-lowering agents on top of statins.
Conflict of interest
Theodosios D. Filippatos reports participation in advisory board for Lilly and lecture honoraria from Boehringer Ingelheim, Mylan, Astra Zeneca, Lilly, Recordati, Bausch Health, Servier, Viatris, Omega-Pharma and Innovis. Michael Kostapanos receives consultancy fees by GlaxoSmithKline (GSK) and Amarin Pharmaceuticals. He is also a Clinical Research Physician Director (as complementary worker by secondment) in the GSK Clinical Unit Cambridge. The remaining authors have no conflicts of interest to declare.