Introduction
Diabetic kidney disease (DKD) (also defined as diabetic nephropathy or chronic kidney disease (CKD)] due to diabetes) is found in approximately 20–40% of all diabetic patients; it is related to higher mortality (cardiovascular and all-cause) [1]. The final manifestations of its evolution are glomerulosclerosis in interplay with tubulointerstitial scarring [1, 2]. Although DKD classically presents with proteinuria, followed by progressive kidney decline, a remarkable percentage of patients with type 2 diabetes (T2D) experience reduced renal function without proteinuria (known as non-proteinuric DKD) [3]. This renal phenotype is clinically and pathologically heterogenous; intrarenal atherosclerosis is a key player in its pathogenesis and development [2, 3].
Hyperglycemia and its multiple aberrant intracellular and biochemical pathways (upregulation of the polyol and hexosamine pathways, generation of advanced glycation end products (AGEs) and activation of protein kinase C (PKC)) are the key and decisive factors for its pathogenesis; elevated blood pressure (BP) is the next more crucial factor followed by obesity or lipotoxicity, insulin resistance (IR), dyslipidemia, cigarette smoking and atherosclerosis [2, 4]. A wealth of evidence suggests that DKD is the result of a multifactorial pathogenic process, which has been closely associated with functional and structural defects [4]. Several cellular/molecular pathways are activated during its progression and govern its evolution. The most important are: (i) hemodynamic alterations; (ii) tubular factors and hypertrophy; (iii) overactive renin-angiotensin-aldosterone system (RAAS); (iv) mitochondrial dysfunction and damage; (v) increased inflammation, endothelial dysfunction, and oxidative stress; (vi) podocyte injury and albuminuria; (vii) impaired glomerular autophagy; (viii) activation of sodium-hydrogen exchangers (NHEs); (ix) intrarenal hypoxia and eventually (x) renal fibrosis [1, 2, 4]. Once fibrosis reaches a certain threshold, DKD progression becomes irreversible [2, 4]. The crosstalk and interplay among several of these pathways determine the complexity of DKD, while the exact contribution of each pathway is currently under intense investigation [4].
A large body of evidence suggests that renal hypoxia is one of the main forces that drives DKD, both in its early and advanced stages [2, 4, 5]. Anoxic renal cells are depleted from energy stores, their actin cytoskeleton and electrolyte gradient are damaged and the expression of several important genes is altered [5]. Intrarenal hypoxia promotes inflammation, generation of intrarenal collagen, capillary rarefaction and accumulation of extracellular matrix that destroys normal renal architecture. Eventually, accelerating non-reversible fibrosis is established [1, 2, 6].
The hypoxia pathway
Introduction
Approximately 7–10% of whole oxygen consumption in the human body is utilized by the kidneys, which are second only to the heart in terms of oxygen per tissue mass [7, 8]. Almost 80% of renal oxygen is consumed for sodium reabsorption by the Na+/K+-ATPase pump, which is located at the basolateral aspect of the tubular cells [8, 9]. By hydrolyzing ATP, it promotes an electrochemical concentration gradient (higher sodium concentration in the glomerular filtrate compared to lower intracellular concentration levels), which is the main driving force for several tubular transporters to co-transport other molecules (such as glucose and water) [2, 7–9]. Hence, the production of ATP is of major importance to power the Na+/K+-ATPase pump and the main determinant of renal oxygen demand. The proximal convoluted tubule (PCT) is responsible for approximately 70% of sodium reabsorption and is the key determinant of kidney oxygen consumption, followed by the delivery of urine to the medullary thick limbs and the transport by local mediators [10]. Under normal circumstances, cells located in the PCT produce ATP using almost exclusively oxidative phosphorylation in the mitochondrial chain, whereas mesangial cells, endothelial cells and podocytes promote ATP generation mainly through glycolysis [11, 12].
Renal perfusion, both in the cortex and the medulla, is pivotal for oxygen supply and is regulated independently. Approximately 10% of total blood flow in the kidney penetrates the renal medulla, establishing a hypertonic interstitium, which concentrates the urine by countercurrent exchange, almost four times higher than plasma osmolality [13]. The renal medulla consists of medullary collecting ducts, loops of Henle, vasa recta (straight capillaries) and the interstitium (lymphocyte-like cells, lipid-laden interstitial cells and pericytes). It has a critical role in controlling tubular function and sodium excretion, as well as in regulating total body fluid volume and blood pressure (BP). The relatively low medulla perfusion (compared to its high metabolic demands) shifts to a borderline hypoxic milieu, as oxygen diffuses from the arterial to the venous vasa recta; early histological changes of this renal area are found in human kidneys with ischemia [14, 15]. The outer medulla is an area vulnerable to hypoxic injury because of low blood flow, the presence of tubules with high metabolic demands (segment 3 [S3] of the PCT and thick limbs of Henle Loop) and the countercurrent exchange of oxygen between the ascending and descending vasa recta. The production of erythropoietin (EPO) from this area is also a response to hypoxic stimuli, to improve hematocrit (Hct) levels and renal oxygen delivery capacity. In contrast, almost 25% of total cardiac output is found in the renal cortex, mainly to regulate glomerular filtration rate (GFR) [13, 16]. Indeed, partial oxygen pressure inside the medulla is about 10–20 mm Hg, while inside the cortex it reaches approximately 50 mm Hg [17].
Renal hypoxia during a diabetic state: pathophysiological concepts
A wealth of evidence has shown upregulation (number and activity) of sodium-glucose co-transporters (SGLT) in patients with hyperglycemia and diabetes, partially due to overall renal tubular hypertrophy [2, 4, 18]. Hence, higher tubular maximum renal reabsorptive capacity (TmG) and enhanced renal threshold for glucose excretion (RTG), as an attempt of the human body to retain glucose, are established. These maladaptive mechanisms create a vicious cycle and contribute to the pathogenesis and maintenance of hyperglycemia [4, 19]. Unfortunately, PCT cells cannot inhibit high glucose transport rates and stop the enormous fluctuations of their intracellular glucose levels. This in turn stimulates higher ATP utilization from Na+/K+-ATPase and finally more oxygen consumption by the mitochondrial chain [4, 18, 20].
Furthermore, due to the abnormally increased sodium and glucose reabsorption in the PCT, the distal sodium chloride delivery to the macular densa of the juxtaglomerular apparatus is significantly decreased [18, 20]. This in turn promotes decreased breakdown of intracellular ATP to adenosine, which has vasoconstrictor activities in this nephron area. Eventually, it can stimulate an afferent renal vasodilatory response, to maintain intraglomerular pressure and GFR (tubular hypothesis, activation of tubuloglomerular feedback (TGF)) [2, 18, 20, 21]. Hyperfiltration and increased glomerular pressure eventually occur. Gradual loss of function in sclerotic glomeruli injures glomerular capillaries, reduces both glomerular and post-glomerular blood flow, suppresses oxygen supply and promotes the development of a renal hypoxic microenvironment [22]. Less severely affected glomeruli can face higher filtration rates at a single nephron (sn) level (compensatory hyperfiltration) causing tubular hypermetabolism. Thus, oxygen expenditure increases enormously for transport activity along the hyperfiltrating nephrons. Eventually, hypoxic kidney damage is established, which triggers several aberrant signaling pathways, promoting inflammation and scarring [18, 22]. RAAS activation and higher vasopressin levels also increase ATP demand through several cellular signaling pathways [18, 23, 24].
On the other hand, reduced renal ATP production during hyperglycemia is found. It is the result of several factors, mainly the following: (i) both IR and glucotoxicity reduce insulin/glucagon ratio and shift renal fuel utilization towards free fatty acid (FFA) oxidation. FFAs promote a lower ATP/oxygen ratio in the respiratory chain; (ii) mitochondrial fragmentation, remodeling and dysfunction lead to higher mitochondrial leak respiration and reduced transport efficacy; (iii) IR suppresses AMP-activated protein kinase (AMPK) expression with subsequently impaired ATP production [4, 18, 19, 25, 26]. Interestingly, the ability of kidneys to stimulate local renal perfusion (the primary determinant of oxygen transport and delivery) during hyperglycemia is minimal. It has been associated with: (i) lower GFR levels; (ii) hyperglycemia-related damage of renal microvasculature; and (iii) the inevitability of a hypoxic medulla due to efficient urine concentration (built up by countercurrent exchange). If blood flow increases enormously inside the medulla, the osmolality gradients can be disrupted. If it is too low anoxia damages the tubules [9, 17]. Overall, a mismatch between ATP demand and ATP production is established, leading to ATP deficit, increased oxygen needs and eventually the establishment of a hypoxic environment. Diabetes can also enhance the sensitivity to renal ischemia/reperfusion injury through: (i) repression of mitochondrial function and mitophagy; (ii) stimulation of inflammation, oxidative stress, and apoptosis; and (iii) evolution of diffuse tubular necrosis [27, 28]. Preclinical data have shown reduced renal tissue oxygenation and increased oxygen demand during a diabetic state, which was the result of higher oxygen consumption due to glomerular hyperfiltration and oxygen loss through mitochondrial leak respiration. Interestingly, this hypoxic environment was shown to precede any evidence of direct renal injury or albuminuria [29, 30].
Hypoxia-inducible factors (HIFs) exert significant roles in the anti-hypoxia defense control and are composed of two subunits: HIF-α, an oxygen-sensitive subunit (its cellular concentration is dependent on oxygen tension), and HIF-β, an oxygen-insensitive subunit [30–32]. High cytoplasmic HIF-α levels due to reduced intracellular oxygen tension promote the generation of a heterodimer between HIF-α and HIF-β, which translocates into the nucleus and stimulates the expression of downstream target genes (such as vascular endothelial growth factor (VEGF), EPO and heme oxygenase-1) [4, 17, 31–33]. Three isoforms of HIF-α have been described: HIF-1α, HIF-2α, and HIF-3α. HIF-1α expression potentiates angiogenesis, as well as proinflammatory, oxidative and profibrotic signaling pathways, leading to glomerulosclerosis and tubulointerstitial fibrosis; it can also exert inhibitory effects on erythropoiesis [4, 18, 34]. HIF-2α is produced from peritubular interstitial fibroblast-like cells of the corticomedullary border and is a strong stimulator of EPO production [4, 18, 35, 36]. HIF-1α also stimulates the autophagic clearance of damaged mitochondria (mitophagy), while HIF-2α promotes the autophagic disposal of injured peroxisomes (pexopathy), so as to preserve the reduced supplies of intracellular oxygen [37]. During a diabetic state higher HIF-1α expression and suppressed HIF-2α activity have been described, which contribute to inflammation and fibrosis [38–40]. HIF-α can also stimulate the production of endothelin-1 (ET-1), which can further affect renal oxygenation by promoting renal cortical vasoconstriction [41].
SGLT2 inhibitors
SGLT2 is found in the early S1 and S2 to the brush-border membrane of the PCT. It reabsorbs filtered sodium and glucose in an equimolar and cotransport manner and is responsible for about 90% of filtered glucose reabsorption [4, 18, 42]. SGLT1 is found in the S3 of the PCT and contributes to the remaining 10%. S1 and S2 are located entirely within the cortex, while S3 resides in the inner cortex and outer stripe of the medulla [4, 18]. SGLT2 inhibitors have a unique pathophysiological mechanism of action, which is completely independent of pancreatic beta (β)-cell secretion and cellular insulin sensitivity. They can achieve approximately 50% less TmG and subsequently promote meaningful glycosuria [1, 2, 4, 16]. They have reduced median glycated hemoglobulin (A1C) levels by 0.6–0.8% in patients with T2D and normal renal function; their antihyperglycemic effect was stronger in patients with T2D who experienced A1C levels ≥ 10% before their administration [18, 42, 43].
SGLT2 inhibitors are unquestionably a practice-changing drug class and a valuable weapon for patients with T2D and CKD. They have achieved major cardiovascular and renal effects in patients with T2D signifying a new era, in which therapeutic strategies should be tailored based on patients’ comorbidities and on end-organ protection, rather than focusing only on decreasing high glucose levels [4, 18]. The Canagliflozin and Renal Events in Diabetes with Established Nephropathy Clinical Evaluation (CREDENCE) trial (median follow-up: 2.62 years, estimated [e] GFR: 30 to < 90 ml/min/1.73 m2, urine albumin-creatinine ratio (UACR): > 300 to 5000 mg/g) showed that canagliflozin (CANA) decreased renal-specific outcome (doubling of serum creatinine levels, end stage renal disease (ESRD), or death from kidney problems) by 34% versus placebo [44]. The Dapagliflozin and Prevention of Adverse Outcomes in Chronic Kidney Disease (DAPA-CKD) study, in which 32.5% of the patients did not experience diabetes, demonstrated that dapagliflozin (DAPA) decreased the renal primary endpoint (sustained eGFR reduction of at least 50%, ESRD or renal death) by 44% versus placebo (median follow-up: 2.4 years, eGFR: 25 to 75 ml/min/1.73 m2, mean UACR: 949 mg/g) [45]. Recently, the Multicentre International Randomized Parallel Group Double-blind Placebo-controlled Clinical Trial of EMPAgliflozin Once Daily to Assess Cardio-renal Outcomes in Patients With Chronic KIDNEY Disease (EMPA-KIDNEY – approximately 54% of the population had no history of diabetes and eGFR ranged from 20 to < 90 ml/min/1.73 m2) showed that empagliflozin (EMPA) reduced the progression of kidney disease or cardiovascular death by 28% versus placebo with no major safety issues (p < 0.001) [46]. In contrast to the previous studies, 20% and 28% of the total population enrolled experienced either normoalbuminuria or microalbuminuria. Data from chronic eGFR slopes suggested that EMPA administration slowed CKD progression across all UACR and eGFR categories independently of the presence or absence of T2D [47].
In view of the robustness of their salutary kidney effects, the 2022 consensus report of the American Diabetes Association and the European Association for the Study of Diabetes stated that for patients with T2D and CKD, who experience eGFR ≥ 20 ml/min/1.73 m2 or UACR > 30 mg/g, an SGLT2 inhibitor having proven benefit should be considered as first line therapy to decrease major adverse cardiovascular events and episodes of heart failure and to improve kidney outcomes; once treatment is started it should be given until dialysis or transplantation is initiated [48]. Furthermore, in the more recent Kidney Disease: Improving Global Outcomes (KDIGO) 2022 clinical practice guideline update for the treatment of diabetes in individuals with CKD, it was stated that metformin (MET) and SGLT2 inhibitors should be the starting combination of choice; MET can only be administered when eGFR is ≥ 30 ml/min/1.73 m2, while SGLT2 inhibitors can be administered when eGFR is ≥ 20 ml/min/1.73 m2 and continued according to patients’ tolerance until dialysis or transplantation is started [49].
The outstanding renal effects of SGLT2 inhibitors cannot be explained only by their beneficial activities on simultaneous improvements of several metabolic parameters (A1c levels, systolic BP and body weight) [4, 18]. In vitro studies, experimental research (preclinical and clinical), sub-analyses of large randomized controlled trials (RCTs)/cardiovascular outcome trials (CVOTs) and investigation of several biomarkers have demonstrated that SGLT2 inhibitors can target multiple and interrelated signaling pathways, including renal hypoxia, independently of their antihyperglycemic activity [18, 50]. Indeed, a prespecified analysis of the DAPA-CKD study showed similar effects of DAPA administration on clinical hard endpoints in patients with or without T2D, with differential effects on UACR reduction (approximately 20% higher reduction in the diabetic population), and suggested that the beneficial effects of DAPA could be mediated in part through signaling pathways unrelated to the reduction of albuminuria [51]. Furthermore, preclinical and clinical data have also shown beneficial activities of SGLT2 inhibitors in IR-associated disorders other than diabetes (such as polycystic ovary syndrome (PCOS), non-alcoholic fatty liver disease (NAFLD)/non-alcoholic steatohepatitis (NASH) and obstructive sleep apnea (OSA)) [52, 53].
SGLT2 inhibitors and renal hypoxia
Pathophysiological concepts
Higher Hct levels were found in the EMPA group versus placebo (mean changes from baseline: 4.8 ±5.5% in the arm treated with 10 mg of EMPA, 5.0 ±5.3% in the arm treated with 25 mg of EMPA and 0.9 ±4.7% in the placebo group) in the EMPA-REG OUTCOME trial [54]. These changes from baseline in Hct and hemoglobulin (Hb) levels after EMPA administration mediated 51.8% and 48.9% respectively, of its effect versus placebo, on the reduction in risk of cardiovascular death. A recent meta-analysis, in which 17 RCTs and data from 14,748 patients with T2D were included, suggested that SGLT2 inhibitors significantly increased Hb levels versus placebo (MD: 0.56 g/dl, p < 0.00001) [55]. Several studies have also shown that after their administration, changes in urine volume and urine glucose excretion were completely different over time from changes in Hb and Hct levels in this population [4, 18, 50]. These observations led to the assumption that these effects could not be solely attributed to hemoconcentration and were the result of increased erythropoiesis with augmented iron utilization [18, 50]. Furthermore, if the increase in Hct/Hb was the result of hemoconcentration due to diuresis, this would be related to volume contraction and subsequent deterioration of kidney function, as seen with long-term diuretic administration [56].
Indeed, SGLT2 inhibitors are expected to suppress increased transport work and renal oxygen consumption in the PCT, correcting the intrarenal mismatch between oxygen demand and oxygen delivery. Consequently, they could ameliorate structural and functional defects of DKD, in addition to or independently of their hemodynamic effects [57]. Sano et al. suggested that SGLT2 inhibitors can reduce high ATP consumption by the Na+/K+-ATPase pump and ameliorate cellular metabolic stress in the PCT. This in turn can suppress hypoxia around the PCT cells and can promote the reversion of myofibroblasts to EPO-producing fibroblasts [58].
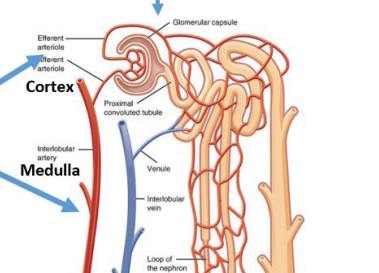
Moreover, after SGLT2 inhibition higher glucose and sodium reabsorption is expected from S3 of the PCT (late proximal tubules) and the medullary area. Hence, high maximal glucose transport rate can be found in these segments. SGLT2 inhibition can increase the proportion of filtered glucose that is reabsorbed in the S3 from 3% to over 40% [18, 56]. The distal tubule is far less energy-efficient, transporting only three molecules of sodium per molecule of ATP compared to the PCT (nine molecules of sodium per ATP) and the thick ascending loop (12 molecules of sodium per ATP) [59]. Hence, the work overload established (in an already physiologically low oxygen availability and less energy efficient region) can amplify oxygen consumption, enhance the expression of protective genes and stimulate the HIF pathway [4, 18, 50]. Specifically, suppressed oxygen tension in the kidney medulla can stimulate HIF-2α secretion by the peritubular interstitial cells, which promotes EPO production. Increased EPO levels can restore the capacity of perfusing blood to carry oxygen and re-establish physiological renal oxygenation (Figure 1).
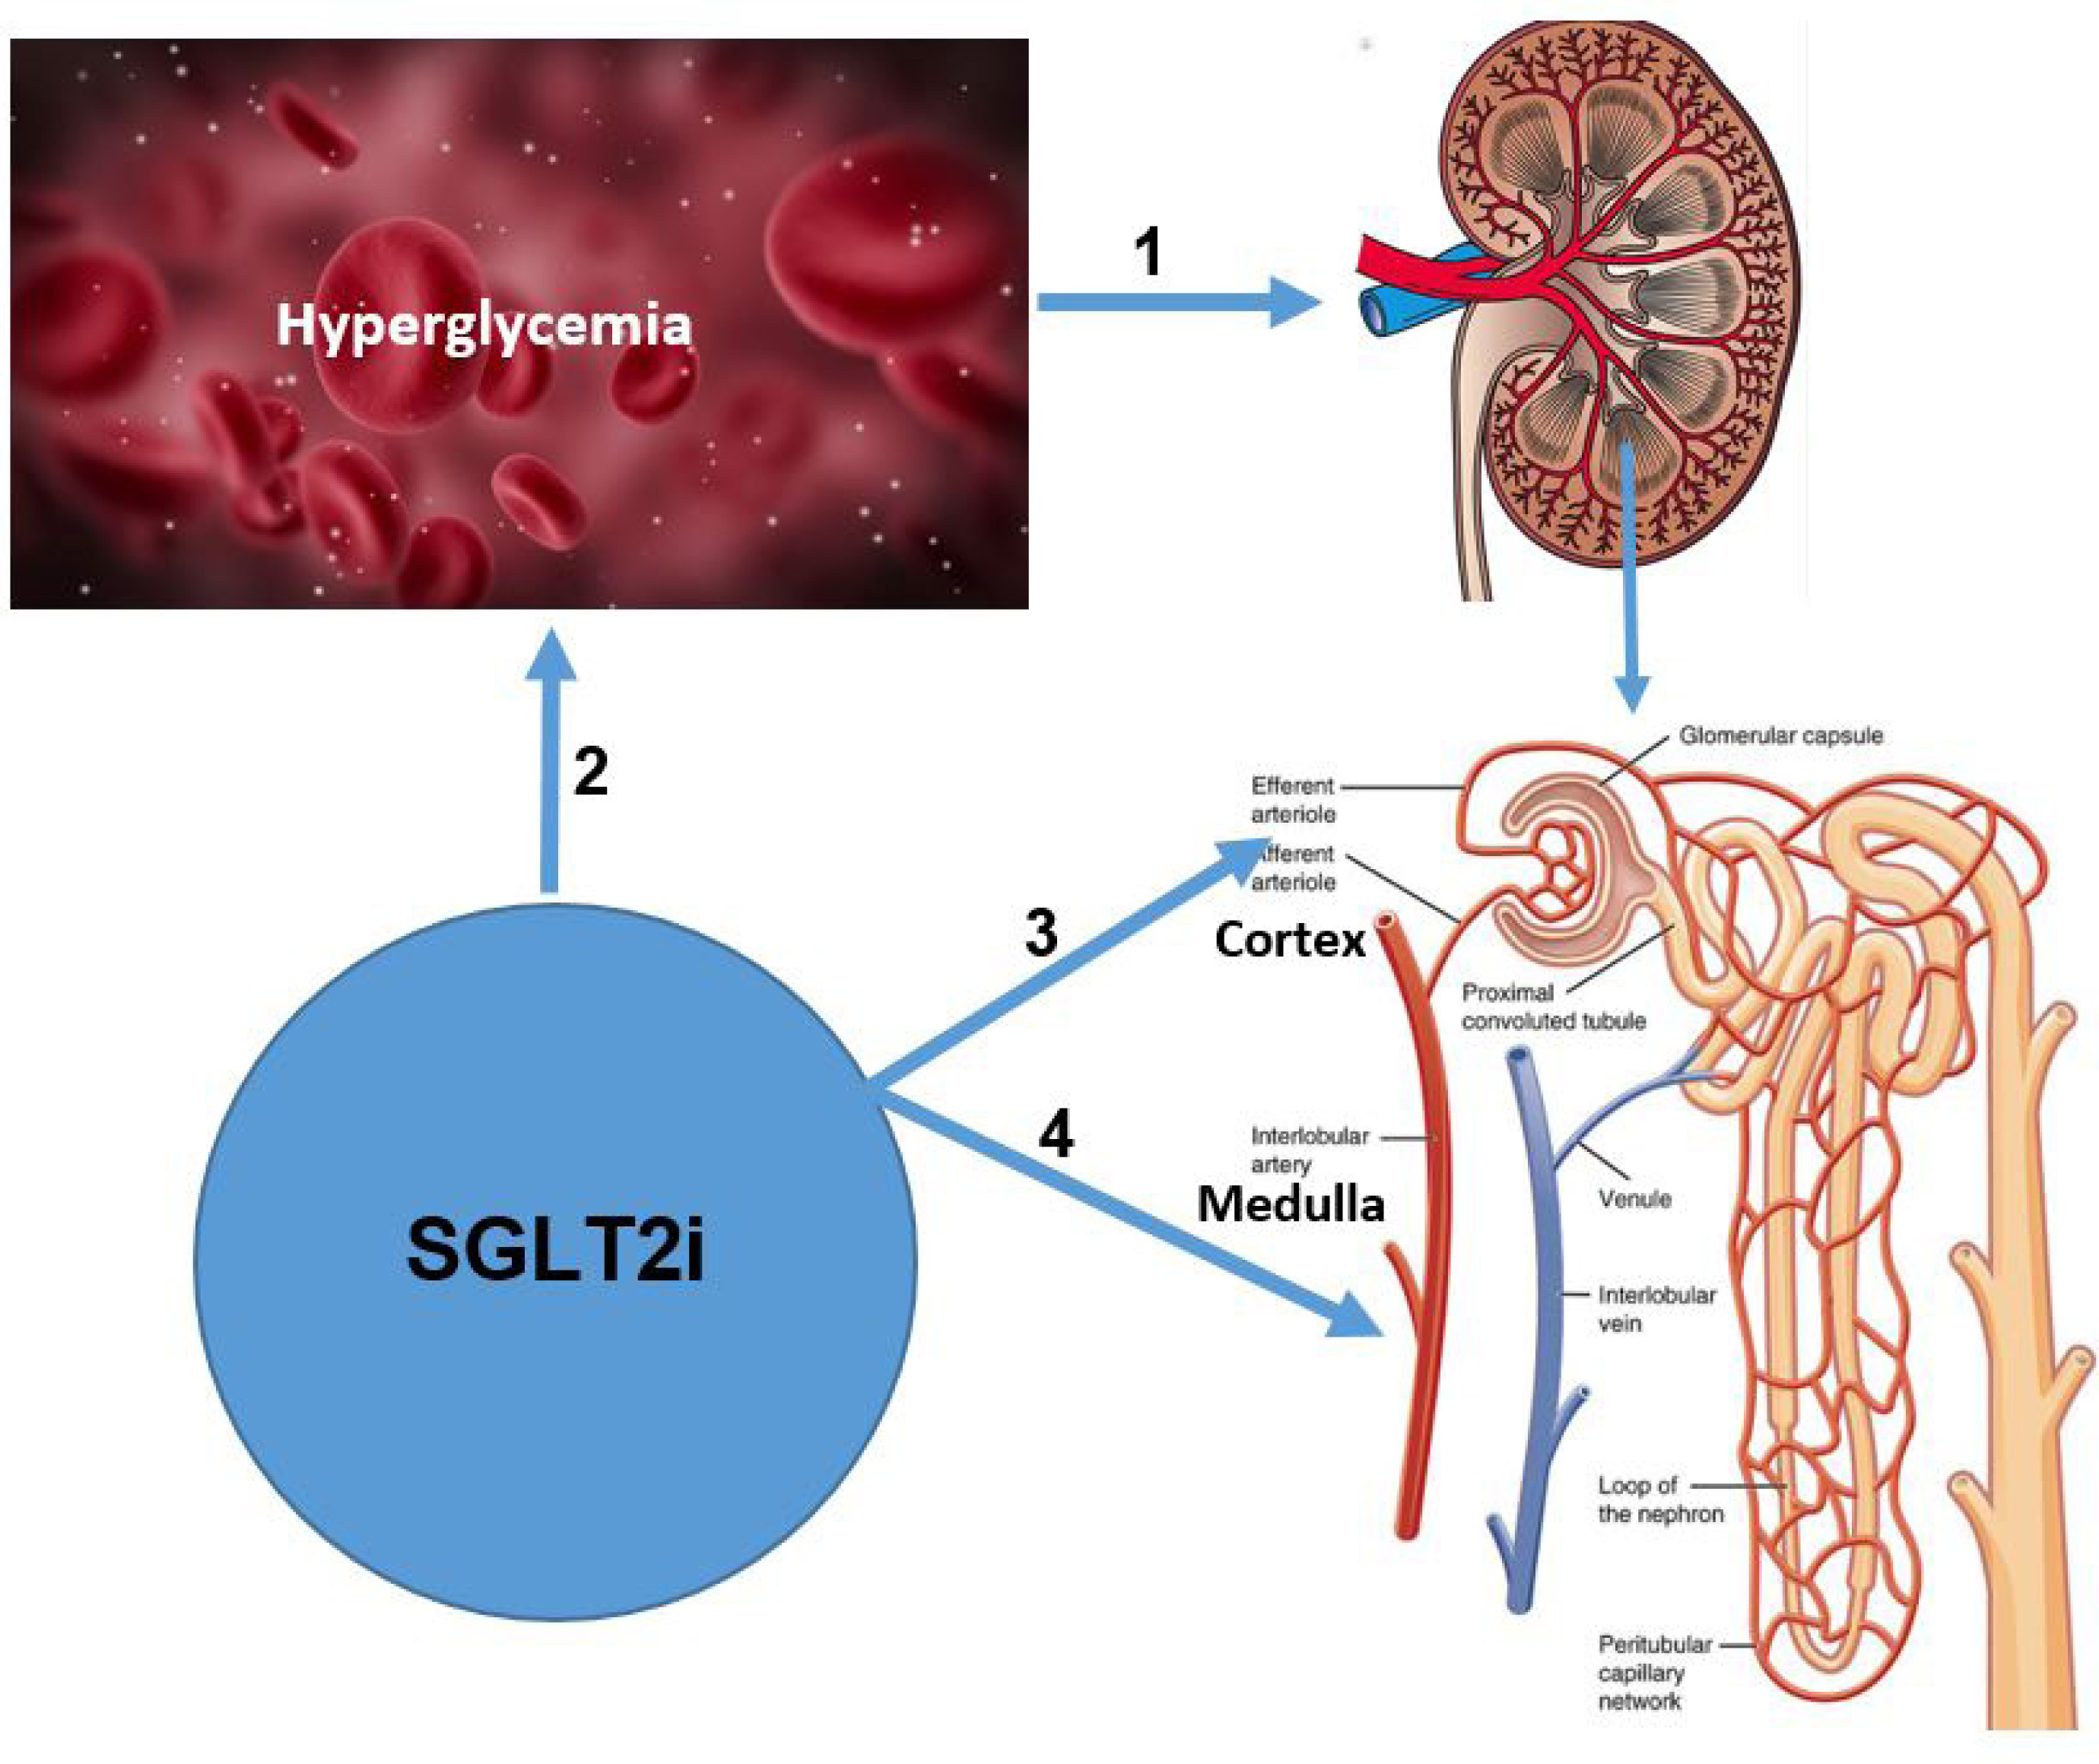
Figure 1
SGLT2 inhibitors modulating renal hypoxia in DKD: possible pathophysiological mechanisms. 1 – During hyperglycemia, renal hypoxia is one of the main forces that drive kidney disease, both in its early and advanced stages. The main mechanisms for its evolution are: (i) SGLT2 in the PCT is upregulated (number and activity). This in turn, stimulates higher ATP utilization from Na+/K+-ATPase and finally more oxygen consumption from the mitochondrial chain; (ii) gradual loss of function in sclerotic glomeruli injures glomerular capillaries, suppresses oxygen supply and promotes development of a renal hypoxic microenvironment. Less severely affected glomeruli can face tubular hypermetabolism. Thus, oxygen expenditure increases enormously for transport activity along the hyperfiltrating nephrons and eventually hypoxia develops; (iii) suppressed renal ATP production (increased FFA oxidation, higher mitochondrial leak respiration/reduced transport efficacy and lower AMPK expression); (iv) reduced renal ability to stimulate local renal perfusion (lower GFR levels, hyperglycemia-related damage of renal microvasculature and the inevitability of a hypoxic medulla); and (v) increased sensitivity to renal ischemia/reperfusion injury. 2 – SGLT2i have a unique pathophysiological mechanism of action, which is completely independent of pancreatic β-cell secretion and cellular insulin sensitivity. They can achieve approximately 50% less TmG and subsequently promote meaningful glycosuria. They have reduced median A1C levels by 0.6–0.8% in patients with T2D and normal renal function. 3 – SGLT2i are expected to suppress increased transport work and renal oxygen consumption in the PCT, correcting the intrarenal mismatch between oxygen demand and oxygen delivery. Consequently, they could ameliorate the structural and functional defects of DKD, in addition to or independently of their hemodynamic effects. 4 – In patients with T2D, SGLT2i promote higher glucose and sodium reabsorption from segment 3 of the PCT (late proximal tubules) and the medullary area. Hence, a high maximal glucose transport rate can be found in these segments. The work overload established (in an already physiologically low oxygen availability and less energy efficient region) can amplify oxygen consumption, enhance the expression of protective genes and stimulate the HIF pathway. Specifically, suppressed oxygen tension in the kidney medulla can stimulate HIF-2α secretion, which promotes EPO production and subsequent erythropoiesis. However, in patients with T1D increased Hct levels were suggested to be the result of natriuresis/osmotic diuresis and subsequent hemoconcentration rather than erythropoiesis.
SGLT2 – sodium-glucose co-transporter 2, SGLT2i – sodium-glucose co-transporter 2 inhibitors, DKD – diabetic kidney disease, T2D – type 2 diabetes, T1D – type 1 diabetes, A1c – glycated hemoglobulin, TmG – tubular maximum renal reabsorptive capacity, FFA – free fatty acid, AMPK – AMP-activated protein kinase, PCT – proximal convoluted tubule, GFR – glomerular filtration rate, EPO – erythropoietin, Hct – hematocrit, HIF – hypoxia-inducible factor.
Preclinical studies (in vitro and in vivo)
Early studies with phlorizin (a competitive inhibitor of SGLT1 and SGLT2) suggested that its administration could alleviate high Na+-K+-ATPase activity in the PCT and suppress sodium reabsorption and Na+-K+-ATPase-dependent oxygen cortical consumption in diabetic rats [60] (Table I). Luseogliflozin (LUSEO) was administered in human renal proximal tubular epithelial cells (HRPTECs) and PCTs of a preclinical model with T2D [61]. LUSEO suppressed the expression of HIF-1α and HIF-1 target genes in HRPTECs, through the reduction of mitochondrial oxygen utilization. In this way, it restored intracellular hypoxia and subsequently increased HIF-1α proteasomal degradation. LUSEO reduced high HIF-1α expression in PCTs and restored tubulointerstitial injury in the renal cortex. It was proposed that LUSEO can rescue renal PCT cells from hypoxia after suppressing glucose entry and decreasing oxygen/ATP consumption by the mitochondrial chain. This was the first study to show that SGLT2 inhibition downregulates the HIF-1α pathway in renal PCT cells, using in vitro and in vivo investigation. Furthermore, both glomerular and tubular expression of HIF-1α were persistently up-regulated in preclinical models of DKD and were significantly inhibited after CANA and EMPA therapy [62, 63]. DAPA administration also suppressed HIF-1α elevation and prevented HIF-1α translocation to the nucleus [64]. Low-dose ipragliflozin (IPRA) improved abnormal glomerular hemodynamic activity and suppressed renal cortical hypoxia in a preclinical model of T2D with early diabetic nephropathy [65]. EMPA administration was finally shown to achieve significantly decreased numbers of cells undergoing endothelial-mesenchymal transition in the peritubular capillaries, suppressing glomerular injury and renal fibrosis; its direct effects on suppressing aberrant glycolysis inside PCT cells was suggested to play an important role in this setting [66].
Table I
Kidney hypoxia and DKD: Results of main preclinical studies of SGLT2 inhibitors
| Ref. | Year* | Preclinical model | Main results |
|---|---|---|---|
| O’Neill et al. [68] | 2015 | STZ induced T1D male Sprague-Dawley rats. Phlorizin was administered intraperitoneally. | Phlorizin reduced glucose and sodium reabsorption in the PCT and attenuated glomerular hyperfiltration. These effects were manifested as higher partial oxygen pressure in their renal cortex. Phlorizin also promoted higher sodium load in more distal parts of the nephron and decreased medullary tissue partial oxygen pressure. |
| Layton et al. [57] | 2016 | An epithelial cell-based model of superficial nephron in a rat kidney. | Acute and chronic SGLT2 inhibition was shown to decrease GFR and suppress active oxygen utilization in the renal cortex by 30%. It also achieved 6% higher oxygen consumption in the medulla (partially by stimulating SGLT1-mediated glucose uptake), 2% in the medullary thick ascending limb, 9% in the outer medullary collecting duct and 21% in the inner medullary collecting duct. |
| Takiyama et al. [67] | 2018 | LUSEO was administered in a T2D model of db/db mice for 8 to 14 weeks. | LUSEO enhanced hypoxia in the juxtamedullary region but not in the cortex. |
| Kamezaki et al. [65] | 2018 | IPRA was administered in a T2D model of db/db mice for 1 to 2 weeks | IPRA therapy suppressed renal cortical hypoxia and abnormal glomerular hemodynamics. |
| Bessho et al. [61] | 2019 | HRPTECs and PCTs in a T2D model of db/db mice. LUSEO was administered for 8 to 16 weeks. | LUSEO suppressed the expression of HIF-1α and HIF-1 target genes in HRPTECs, through the reduction of mitochondrial oxygen utilization. LUSEO reduced high HIF-1α expression in PCT cells and restored tubulointerstitial injury in the renal cortex. |
| Hodrea et al. [64] | 2020 | STZ induced T1D in adult male Wistar rats. DAPA was administered for 6 weeks either as monotherapy or combined with losartan. | DAPA administration suppressed HIF-1α elevation and prevented HIF-1α translocation to the nucleus. |
| Li et al. [63] | 2020 | EMPA was administered for 1 month in a mouse model of DKD and fibrosis. HK2 proximal tubular cell line was also investigated. | ΕMPA reduced tubular expression of HIF-1α. |
| Hare et al. [69] | 2021 | STZ-induced diabetes in male Sprague-Dawley rats. DAPA was administered for 6 weeks. | DAPA reduced microvascular oxygen tension in a space that ranges between the deeper cortical and outer medullary tissues. Oxygen tension in the superficial cortex remained unchanged. DAPA also stimulated HIF-dependent EPO production and EPO-derived erythropoiesis. |
| Inada et al. [62] | 2022 | CANA was administered for 50 weeks in a mouse model of severe diabetic nephropathy. | CANA reduced tubular nuclear expression of HIF-1α. |
DKD – diabetic kidney disease, SGLT2 – sodium-glucose co-transporter 2, GFR – glomerular filtration rate, STZ – streptozotocin, HRPTECs – human renal proximal tubular epithelial cells, PCT – proximal convoluted tubule, T2D – type 2 diabetes, T1D – type 1 diabetes, HIF – hypoxia-inducible factor, LUSEO – luseogliflozin, DAPA – dapagliflozin, IPRA – ipragliflozin, ΕMPA – empagliflozin, CANA – canagliflozin, EPO – erythropoietin, Ref. – reference,
LUSEO administration in diabetic mice enhanced hypoxia in the juxtamedullary region (S3 of PCT and juxtaglomerular apparatus) but not the cortex [67]. A well-organized preclinical study, which developed a mathematical model of a rat nephron ranging from the Bowman space up to the papillary tip, estimated diabetes-related alterations in nephron structure, GFR and protein expression of tubular transporters [57]. Overall, diabetes increased sodium reabsorption by approximately 50% and the rate of oxygen consumption by 100%; this was the result of subsequent hyperfiltration and higher tubular transport load. Acute and chronic SGLT2 inhibition was shown to decrease GFR and suppress active oxygen utilization in the renal cortex by 30%. It also achieved 6% higher oxygen consumption in the medulla (partially by stimulating SGLT1-mediated glucose uptake), 2% in the medullary thick ascending limb, 9% in the outer medullary collecting duct and 21% in the inner medullary collecting duct, supporting the redistribution hypothesis. Another study organized in a rat model of T1D showed that phlorizin reduced glucose and sodium reabsorption in the PCT and attenuated glomerular hyperfiltration; these effects were manifested as higher partial oxygen pressure in their renal cortex and suppression of renal cortical hypoxia [68]. However, phlorizin promoted a higher sodium load in more distal parts of the nephron and suppressed medullary partial oxygen pressure.
A study performed in rats with streptozotocin-induced diabetes examined the possible effects on renal tissue oxygen delivery/consumption in different areas (the superficial cortex that includes S1 and S2 versus the deeper cortex/outer medulla that includes S3 and medullary thick ascending limbs) estimating microvascular renal oxygen tension [69]. DAPA reduced microvascular oxygen tension in a space that ranges between the deeper cortical and outer medullary tissues. Afferent arteriolar constriction and increased workload more distally inside the nephron were the main factors to explain these findings. Oxygen tension in the superficial cortex remained unchanged. DAPA also stimulated the expression of HIF-dependent EPO and EPO-derived erythrogenesis, as a compensatory response to lower medullar oxygen tension. Overall, the transport shift induced by this drug category can promote systemic hypoxia in the deep cortex and renal outer medulla, stimulating cellular pathways that can have renoprotective effects. Reduced circulating hepcidin levels, alterations of other iron regulatory proteins, higher β-hydroxybutyrate (BHB) levels and upregulation of the AMPK/sirtuin 1 (SIRT 1) pathway were also proposed as other mechanisms for EPO stimulation [70, 71].
Clinical studies
A multicenter, randomized, double-blind, three-arm, parallel-group, placebo- and active-controlled study investigated 75 patients with T2D (eGFR > 60 ml/min/1.73 m2, A1c ≥ 6.6% and ≤ 9.5%, treated with a stable dose of MET and/or a sulfonylurea for at least 4 weeks prior randomization), who were randomized to receive either DAPA 10 mg every day (n = 24) or hydrochlorothiazide (HCTZ) 25 mg every day (n = 26) or placebo (n = 25) in a 1 : 1 : 1 ratio for 12 weeks [72]. At the end of the study Hct increased by 2.2 in the DAPA arm versus –0.2 and –0.9 in the placebo and HCTZ arms, respectively. Hb levels increased by 0.6 mg in the DAPA arm versus –0.1 and –0.3 in the placebo and HCTZ arms, respectively. Mean reticulocyte (RET) count and serum EPO levels increased transiently from baseline in the DAPA arm up to the fourth week, followed by a gradual decline until the end of the study. DAPA administration and not HCTZ promoted a sustained 7% reduction in plasma volume.
In another study 808 patients with T2D, whose disease was inadequately controlled with at least 30 units of daily insulin (with or without up to two oral antihyperglycemic medications), were randomized to receive either DAPA in a daily dose of 2.5, 5 or 10 mg versus placebo for 104 weeks [73]. After 48 weeks patients on DAPA 5 mg changed to 10 mg. The combination of DAPA/insulin promoted higher Hct levels in a dose-dependent fashion versus placebo/insulin at 12 weeks. Then Hct levels stayed stabilized until 104 weeks. Red blood count (RBC) values also spiked in a dose-dependent fashion after 12 weeks of DAPA administration. Higher short-term RET values up to the fourth week were described only in the DAPA arm (EPO levels were not measured), followed by a sharp decline at 12 weeks. DAPA was also administered in 52 patients with T2D and obesity on oral antidiabetic medications for 12 weeks versus placebo [74]. Eventually 24 participants in the DAPA arm and 23 in the placebo arm completed the study. Higher Hb and Hct levels (p = 0.02 respectively) were found in the DAPA arm versus placebo. Iron concentrations were reduced by 16 ±6% at 6 weeks of therapy, while ferritin levels dropped by 32 ±7%, suggesting greater mobilization and utilization of iron. EPO levels were increased transiently after 6 weeks of therapy versus baseline values but were not significantly different from those in the placebo arm. Hepcidin (a protein that inhibits the ability of ferroportin to transport iron and is found increased in anemia of chronic inflammation) was suppressed by 24 ±3% after 12 weeks of DAPA administration (p = 0.007). HIF-1α mRNA expression in mononuclear cells was suppressed by 42 ±15% at 6 weeks (p = 0.015 versus placebo) and by 32 ±12% at the end of the study (p = 0.022 versus baseline). A small study investigated the possible role of CANA regarding erythropoiesis in patients with T2D and CKD [75]. Nine patients (eGFR: 45.2 ±6.2 ml/min/1.73 m2, UACR: 191 (68–2255) mg/g) were treated with 100 mg of CANA every day for a total of 12 weeks. Serum EPO levels were higher by 38% between baseline values versus 2 and 4 weeks of therapy (p = 0.043). After 2 weeks of therapy RET count transiently spiked, while Hb (p = 0.0049) and Hct (p = 0.002) levels were higher from baseline until the end of the study. Serum ferritin levels were also decreased (p = 0.003).
Three studies investigated the role of EMPA in erythropoiesis in patients with T2D [76–78]. In the first study EMPA was administered every day in a dose of 25 mg for 4 weeks in 66 patients with T2D and eGFR ≥ 60 ml/min/1.73 m2 [76]. Twenty-five individuals without diabetes (12 with normal glucose tolerance and 13 with impaired glucose tolerance) served as controls. Fasting EPO levels were 31% higher (p = 0.0078) after EMPA administration compared to baseline values but not significantly different from those in the control arm. Hb and albumin concentrations were reciprocally associated with EPO levels. The second was a sub-study of the EMPA-HEART (Effects of Empagliflozin on Cardiac Structure in Patients With Type 2 Diabetes) CardioLink-6, in which 90 patients with T2D and stable coronary artery disease (data from 82 participants were finally evaluated) received EMPA 10 mg daily for 6 months versus placebo [77]. EPO levels were significantly higher 1 month after EMPA administration (adjusted difference between the two arms: 3.86 mIU/ml, p < 0.05). Hct levels were significantly higher after 6 months of EMPA administration by 2.34% versus placebo (p < 0.001), while ferritin levels were simultaneously suppressed (mean difference –21.83 µg/l, p < 0.01) as well as mean cell Hb concentration (–5.83 g/l, p < 0.01). Overall, EMPA administration promoted an early increase in plasma EPO levels that was associated with higher Hct and reduced ferritin levels at 6 months. The third study was a post-hoc analysis of the EMPA-REG hemodynamic trial, in which 44 individuals with T2D received either EMPA 10 mg daily or placebo for 3 months together with their current medication [78]. EMPA promoted higher Hb and Hct levels in a delayed kinetic time, 3 months after the beginning of therapy and not after 1 or 3 days, suggesting that hemoconcentration was not the main mechanism for these findings. EPO levels were increased (p = 0.0117), while ferritin levels (p = 0.017), iron levels (p = 0.053) and transferrin saturation (p = 0.030) were reduced after 3 months, suggesting increased erythropoiesis. Interestingly this effect was significantly correlated only with changes in urine glucose secretion and not natriuresis.
As far as T1D population is concerned, 15 patients with albuminuria (20% experienced macroalbuminuria, mean eGFR: 73 ml/min/m2/1.73 m2) were randomized to receive either DAPA 50 mg/daily or placebo separated with a 2 week wash out period between the two treatments arms [79]. The daily dose of DAPA was five times higher than the normal, to provide a stronger signal in the acute setting. DAPA achieved significantly lower cortical renal oxygenation (assessed indirectly by MRI) versus placebo after 6 h. Since there was no differentiation between the two arms in terms of renal tissue perfusion, blood oxygenation, renal blood flow, baroreflex sensitivity and mitochondrial energy production, it was suggested that suppressed cortical oxygen demand after DAPA administration was the main reason for this finding. No significant improvement of medullary oxygenation was found. EMPA was also administered in patients with T1D during the Empagliflozin as Adjunct to inSulin thErapy (EASE) trials 2 and 3 as an adjunct to insulin [80, 81]. In these studies, higher Hct levels were found after EMPA administration. Since: (i) increased Hct levels were associated with higher serum albumin levels (which are not sensitive to EPO); (ii) serum albumin and Hct levels were rapidly suppressed after EMPA was stopped; and (iii) mechanistic studies did not show any long-term rise in EPO and RET levels in this population, it can be speculated that natriuresis/osmotic diuresis and subsequent hemoconcentration, rather than erythropoiesis, were the main underlying mechanisms for this effect. Major results of clinical trials that investigated the effects of SGLT2 inhibitors on renal oxygenation and parameters of erythropoiesis are shown in Table II.
Table II
Renal hypoxia and DKD: Results of main clinical studies of SGLT2 inhibitors
| Ref.x/year* | Study population | Study design | Major results |
|---|---|---|---|
| Lambers Heerspink et al. [72]/2013 | 75 patients with T2D. | Patients were treated with DAPA 10 mg/day (n = 24) or HCTZ 25 mg/day (n = 26) or placebo (n = 25) in a 1 : 1 : 1 ratio for 12 weeks. | Hct was increased by 2.2 in the DAPA arm versus –0.2 and –0.9 in the placebo and HCTZ arms respectively. Hb levels increased by 0.6 mg in the DAPA arm versus –0.1 and –0.3 in the placebo and HCTZ arm respectively. Mean serum EPO levels and RET count increased from baseline only in the DAPA arm up to the fourth week followed by a gradual decline until week 12. |
| Ferrannini et al. [76]/2017 | 66 individuals who had T2D. 25 individuals without diabetes (12 with NGT and 13 with IGT) served as controls. | EMPA was given every day in a dose of 25 mg for 4 weeks. | Serum EPO levels were 31% higher (p = 0.0078) after EMPA administration but not significantly different from those in the control arm. Hb and albumin concentrations were reciprocally associated with EPO levels. |
| Maruyama et al. [75]/2019 | Nine patients with T2D and anemia of CKD. | CANA was administered in a daily dose of 100 mg for 12 weeks. | Serum EPO levels increased by 38% (p = 0.043) between baseline values and 2 and 4 weeks after therapy. After 2 weeks of therapy RET count transiently spiked. Hb (p = 0.0049) and Hct (p = 0.002) levels were higher from baseline values until the end of the study. Serum ferritin levels were reduced (p = 0.003). |
| Aberle et al. [73]/2020 | 808 participants with T2D whose disease was not well controlled with at least 30 units of insulin daily (with or without up to two oral antihyperglycemic medications). | Patients were randomized to receive 2.5, 5 or 10 mg/day of DAPA or placebo for a total of 104 weeks. At 48 weeks patients who were treated with DAPA 5 mg changed to 10 mg. | Patients treated with DAPA/insulin experienced higher Hct levels in a dose-dependent fashion compared to placebo/insulin at 12 weeks. Then Hct levels remained stabilized until the end of the study. RET levels were increased up to the fourth week only in the DAPA arm, followed by a sharp decline at week 12. |
| Ghanim et al. [74]/2020 | 52 patients with T2D and obesity on oral antidiabetic drugs. | DAPA was administered in a daily dose of 10 mg for 12 weeks versus placebo. Eventually 24 participants in the DAPA arm and 23 in the placebo arm completed the study. | Higher Hb and Hct levels (p = 0.02 respectively) were found in the DAPA arm versus placebo. Iron concentrations were reduced by 16 ±6% at 6 weeks of therapy, while ferritin levels fell by 32 ±7%, suggesting greater mobilization and utilization of iron. EPO was increased transiently after 6 weeks of therapy versus baseline values but was not significantly different from the placebo arm. Hepcidin was suppressed by 24 ±3% after 12 weeks of DAPA administration (p = 0.007). HIF-1α mRNA expression in mononuclear cells was suppressed by 32 ±12% at the end of the study (p = 0.022 versus baseline). |
| Mazer et al. [77]/2020 | 90 individuals who experience T2D and stable CAD. Data from 82 individuals were finally evaluated. | EMPA was administered in a daily dose of 10 mg for 6 months versus placebo. | EPO levels were significantly higher after 1 month of EMPA therapy (adjusted difference between the two arms: 3.86 mIU/ml, p = 0.0088). Hct levels were significantly higher after 6 months of EMPA administration compared to placebo (2.34, p < 0.001), while ferritin levels were suppressed (mean difference –21.83 µg/l, p < 0.01). |
| Thiele et al. [78]/2021 | 44 individuals with T2D. | Participants received either EMPA 10 mg daily or placebo for 3 months together with their current medical therapy. | EMPA promoted a significant increase in Hb and Hct levels in a delayed kinetic time 3 months after the beginning of therapy. EPO levels were increased (p = 0.0117), while ferritin levels (p = 0.017), total iron levels (p = 0.053) and transferrin saturation (p = 0.030) were reduced, suggesting increased erythropoiesis. |
| Laursen et al. [79]/2021 | 15 patients with T1D, albuminuria and mean eGFR: 73 ml/min/m2/1.73 m2. | DAPA was given in a dose of 50 mg versus placebo in random order, separated by a 2-week washout period. | DAPA achieved significantly lower cortical renal oxygenation (assessed indirectly by MRI) versus placebo after 6 h. Suppressed cortical oxygen demand after DAPA administration was suggested to be the main reason for this beneficial effect. |
| Cherney et al. [80]/2021 | Patients with T1D who were enrolled in the EASE program. | In the EASE-2 study patients were randomized to receive EMPA 10 mg (n = 243) or 25 mg (n = 244) or placebo (n = 243) for 52 weeks. In the EASE-3 study patients were randomized to receive either EMPA 2.5 mg (n = 241) or 10 mg (n = 248) or 25 mg (n = 245) or placebo (n = 241) for 26-weeks. | Since: (i) increased Hct levels were associated only with elevations in serum albumin levels; (ii) serum albumin and Hct levels were rapidly decreased after EMPA was stopped; and (iii) mechanistic studies did not show any long-term rise in EPO and RET levels, it was suggested that natriuresis and subsequent hemoconcentration rather than erythropoiesis were the main mechanisms responsible for this effect. |
DAPA – dapagliflozin, EMPA – empagliflozin, CANA – canagliflozin, HCTZ – hydrochlorothiazide, T2D – type 2 diabetes, T1D – type 1 diabetes, NGT – normal glucose tolerance, IGT – impaired glucose tolerance, CKD – chronic kidney disease, Hct – hematocrit, Hb – hemoglobulin, RET – reticulocyte, EPO – erythropoietin, CAD – coronary artery disease, MRI – magnetic resonance imaging, HIF – hypoxia-inducible factor, eGFR – estimated glomerular filtration rate, EASE – Empagliflozin as Adjunct to inSulin thErapy, Ref. – reference,
Conclusions
Renal hypoxia is a key driver for the evolution of DKD, both in its early and advanced stages [2, 4, 18, 50]. Preclinical evidence has shown that acute and/or chronic SGLT2 inhibition decreased hyperfiltration, suppressed active oxygen utilization in the renal cortex and reduced tubular expressions of HIF-1α. SGLT2 inhibitors also promoted higher sodium load in more distal parts of the nephron and decreased medullary partial oxygen pressure, an effect that could stimulate HIF-2α dependent EPO production.
Acute SGLT2 inhibition after DAPA administration, given in doses five times higher than normal, promoted significantly lower cortical renal oxygenation after suppressing increased cortical oxygen demand. However, whether the same acute effect could be achieved with the daily maximum approved dose of DAPA (10 mg daily) and/or during prolonged treatment periods needs further investigation, and additional human studies are needed [82]. Clinical studies in patients with T2D suggested that this drug category increased parameters of erythropoiesis (EPO, RET) concurrently with lower ferritin and iron levels for the first 12 weeks of therapy, suggesting greater mobilization and utilization of iron to generate red blood cells. These changes were followed by long-term and dose-dependent increases in Hb and Hct levels (both in patients treated with and those treated without insulin). However, in some studies EPO levels/RET release declined after the first 2 to 12 weeks of therapy, suggesting that higher EPO levels could only partially be responsible for the long-term rise in Hct/Hb. Other possible mechanisms could be: (i) suppression of renal inflammation, metabolic/oxidative stress, angiogenesis and cell growth in PCT cells; (ii) higher BHB levels, which can act as super body fuel and enhance kidney oxygen efficiency by approximately 10%; (iii) suppression of protein-induced hyperfiltration and energy consumption by increasing glucagon levels; (iv) prevention of aberrant tubular glycolysis; and (v) modification of sympathetic activity [83–86]. In patients with T1D increased Hct/Hb levels were the result of natriuresis/osmotic diuresis and subsequent hemoconcentration rather than increased erythropoiesis, emphasizing the different pathophysiology of renal nephropathy in these two diabetic populations.
The effects of SGLT2 inhibition on the regulation of intrarenal hypoxia are complex and multifactorial, involving several signaling pathways, while the exact contribution of each pathway (from enhanced glycosuria to oxygen availability and promotion of EPO generation) is currently under investigation. The possible synergistic mechanisms of their combinations with other antihyperglycemic medications with possible anti-hypoxic renal effects (such as GLP-1R agonists and/or pioglitazone) are also under research [87–91]. Future well-designed mechanistic studies in different diabetic populations will be critical to clarify the exact mechanisms responsible for their effects in modulating kidney hypoxia and their contribution to achieve long-term renoprotective benefits.