Introduction
Advanced oxidation protein products (AOPP) are secreted during oxidative stress [1, 2]. AOPP are formed when chlorinated oxidants, such as chloramines and hypochlorous acid (HOCl), react with plasma proteins [3], and they are often derived from plasma albumin [4]. Oxidative modification of proteins leads to the formation of dityrosine, pentosidine and protein products containing carbonyl [5].
As uremic toxins, a close correlation between AOPP or advanced glycation end-products (AGEs)-pentosidine and monocyte activation markers was reported in the inflammatory syndromes [6, 7]. AOPP are involved in kidney disease pathogenesis by increasing glomerulosclerosis progression, interstitial fibrosis and tubular atrophy [8, 9].
Cardiovascular disease and accelerated atherosclerosis are the main causes of mortality in chronic kidney disease (CKD) patients [10]. Oxidative modification of proteins leads to the formation of dityrosine through a reaction of myeloperoxidase that accelerates atherogenesis [11]. Therefore, AOPP are considered as pro-atherogenic inflammatory markers [12]. Likewise, carbonylation of plasma proteins, which reflect carbonyl stress, are often diagnosed in association with atherosclerosis in CKD patients [13].
Atherosclerosis is a multiple inflammatory-proliferative process caused by several factors. It involves a series of pathological processes affecting the cardiovascular and immune systems, and lipid metabolism [14]. The pathogenic effect of oxidative stress involves the increased mechanisms of pro-atherosclerosis associated with increased cardiovascular risk in CKD patients [15]. Furthermore, increased mitochondrial production of reactive oxidative species (ROS) might activate pro-inflammatory pathways and affect lipid and protein structure and enzymatic activity [16].
Inflammation plays an important role in the pathogenesis of atherosclerosis [17], and the accumulated AOPP in CKD increase oxidative stress and inflammation [18]. In turn, oxidative stress and inflammation increase AOPP secretion by stimulating leukocytes to produce more oxidative stress mediators [19]. This positive feedback loop would maintain and amplify oxidative stress and inflammation, thus contributing to the formation of atheroma and atherosclerosis [20]. Diabetes affects almost every country and the prevalence has reached epidemic proportions. While diabetes already affects more than 8% of the world’s population (nearly 350 million people) [21], it is expected to reach more than 550 million people by 2035 [22]. Diabetic nephropathy is one of the most serious and advanced complications of diabetes [23].
Vit-E is considered as one of the major antioxidants [24]. Although Vit-E therapy has been widely studied in patients with CKD, the benefit obtained from its administration remains poorly documented [25, 26]. Recent studies have shown that long-term usage of Vit-E-coated hemodialysis filters reduced oxidative stress as well as inflammatory markers [27, 28]. Fewer data are available about the benefit of oral supplementation of Vit-E on reducing AOPP values [29, 30].
The aims of this study were to determine AOPP values in CKD patients and their association with atherosclerosis, and to evaluate the effectiveness of Vit-E treatment in reducing AOPP levels and slowing down the process of vascular atherosclerosis.
Material and methods
A descriptive longitudinal study with prospective collection was conducted on 205 CKD patients who presented to the nephrology department of Parnet Hospital, Algeria over a period of four years. The first 2 years were used to collect samples from CKD patients who met the inclusion criteria. As a control group, 40 healthy patients were included in the study. It is a group of young medical students with an average age of 34, body mass index (BMI) below 22 kg/m2, non-smokers and sex ratio of 1.2. All patients were subject to blood sampling, before hemodialysis, for biological markers and AOPP measurements, and paraclinical examination using a supra-aortic trunk echo-Doppler (SAT) to monitor the progression of the atherosclerosis. All the examinations were conducted every 3 months, for 2 years.
As inclusion criteria, all patients over 18 years of age, with CKD of different origins and at different stages, including hemodialysis patients, were included. Additional requirements were that the patients had been clinically stable for 3 months prior the onset of the study and had not received treatment with injectable iron, since the latter is an important source of generation of oxygen free radicals [31]. Furthermore, persons excluded from the study were CKD patients with: pre-existing heart disease before the diagnosis of CKD, severe valve disease, constrictive pericarditis, systolic dysfunction with an ejection fraction (EF) less than 50%, glomerular filtration rate (GFR) greater than 90 ml/min as well as patients on peritoneal dialysis. For the hemodialysis group, we excluded patients with less than 6 months of dialysis.
CKD patients were categorized into five groups according to the classification of CKD proposed by Kidney Disease Improving Global 2012 (KDGO) [32]. Stages were estimated based on creatinine clearance, which we calculated by the CKD-EPI formula [33]. Stage 2 (n = 41) was characterized by mild CKD with creatinine clearance of 89–60 ml/min. Stage 3 (n = 41) represented moderate CKD with creatinine clearance of 59–30 ml/min. Stage 4 (n = 41) included patients with severe CKD and creatinine clearance of 29–15 ml/min. Stage 5 (n = 81) was characterized by highly severe CKD with creatinine clearance less than 15 ml/min. Patients from stage 5 who started extra-renal purification by hemodialysis were categorized as stage 5D (n = 41). The mean duration in hemodialysis was 83 ±6.5 months. We excluded stage 1 patients from the study since they had GFR > 90 ml/min, which is a normal rate and similar to the control group, but they had a confirmed CKD. By the end of the first 2 years, 24 CKD patients had died.
During the last 2 years of the study, CKD patients were divided into two groups. The first group (n = 89) received oral supplementation of 300 mg/d of Vit-E while the second group did not receive treatment (n = 92). The patients were clinically followed for 2 years during which blood samples for AOPP measurement were obtained and SAT was conducted for monitoring the progression of atherosclerosis before and after treatment.
Measurement of biological parameters
All samples were taken before the hemodialysis session to not have any interaction with heparin.
Blood samples were used for the measurement of calcium, phosphorus and parathyroid hormone (PTH), which represent significant markers of calcium-phosphorus metabolism in CKD patients. Furthermore, risk factors for cardiovascular complications, mainly cholesterol, triglyceride and serum high-density lipoprotein cholesterol (HDLc), were measured. As inflammatory markers, ultrasensitive C-reactive protein (CRPus) was evaluated.
Oxidative stress marker measurements were performed on plasma from blood samples in tubes containing dipotassium ethylenediaminetetra acetic acid (EDTA K2). Once the blood samples were taken, the tubes were centrifuged for 10 min at 4500 rpm (3900 g), then aliquoted and stored at –20°C until further analysis. AOPP were measured by a colorimetric method using an ultraviolet spectrophotometer in the presence of potassium iodide and acetic acid. The optical density was measured at 340 nm [34, 35].
Ultrasonography exploration
SAT was explored using a TOSHIBA XARIO ultrasound system with 3.5 MHz probe allowing the carotid and vertebral axes to be analyzed. The examination of the carotid axis involved the primary carotid, the carotid bifurcation, and the internal and external carotids. The vertebral artery was analyzed from its origin and in its intervertebral portion. The brachiocephalic arterial trunk and the two subclavian arteries were also explored.
The intima-media thickness (IM) measurement of the primary carotid was performed at the posterior wall of the primary carotid at a distance from a plate and the carotid bifurcation. At this level, the arterial wall has three borders: the hyperechoic internal border (intima), the hypoechoic middle border (media) and finally the hyperechoic external border corresponding to the adventitia. The IM measurement included both inner and middle borders. An IM ≥ 1 mm was considered as pathological. The upper limit of the IM was set at a threshold of 0.75 mm in healthy persons [36].
Statistical analysis
Statistical analysis was performed using the SPSS vs. 22 software. Student’s t test was used for comparison of two means. The comparison of more than two means of the continuous variables was made by ANOVA test for the parametric tests and the Welch and Brown-Forsythe test was used for the non-parametric variables. The Tukey’s test was used for multiple comparisons. Pearson’s χ2 test was used for comparison of categorical variables. A Kaplan-Meier survival curve was drawn for the Vit-E treatment group. Statistical tests were considered significant at a p-value of 0.05.
Results
The studied populations’ characteristics and analyzed markers are summarized in Table I.
Table I
Descriptive characteristics and levels of biological markers of the studied population
| Parameter | Control | Stage 2 | Stage 3 | Stage 4 | Stage 5 | Stage 5D |
|---|---|---|---|---|---|---|
| Number | 40 | 41 | 41 | 41 | 40 | 41 |
| Age [years] | 34 ±6.76 | 49 ±13 | 56 ±4 | 48 ±5.89 | 66 ±7.8 | 42 ±6.7 |
| Biological parameters: | ||||||
| Cholesterol [g/l] | 1.84 ±0.45 | 1.97 ±0.87 | 1.69 ±0.33 | 1.65 ±0.52 | 1.55 ±0.24 | 1.4 ±0.34 |
| HDLc [g/l] | 0.45 ±0.03 | 0.48 ±0.07 | 0.42 ±0.06 | 0.4 ±0.08 | 0.38 ±0.04 | 0.3 ±0.03 |
| Triglyceride [g/l] | 1.22 ±0.12 | 1.26 ±0.27 | 1.49 ±0.32 | 1.62 ±0.54 | 1.69 ±0.87 | 1.92 ±0.64 |
| CRPus [mg/l] | 0.12 ±0.02 | 1.13 ±0.45 | 2.97 ±0.96 | 4.54 ±1.34 | 5.65 ±2.45 | 8.23 ±2.78 |
| Ca [mg/l] | 87.98 ±12 | 90.34 ±12 | 86.023 ±6.6 | 82.42 ±8.45 | 77.24 ±9.67 | 76.21 ±13 |
| P [mg/l] | 23.56 ±5.78 | 31.17 ±9.67 | 33.10 ±7.67 | 49.09 ±5.7 | 61.42 ±11.4 | 48.18 ±9.9 |
| PTH [pg/ml] | 45 ±7.98 | 76.53 ±25 | 97.52 ±14 | 190.90 ±34 | 552.22 ±22 | 700.03 ±33 |
| AOPP [µmol/l] | 24.92 ±6.19 | 38 .51 ±5.81•• | 50.5 ±10.19••• | 58.4 ±14.46•••• | 68.17 ±11.93•••• | 78.82 ±10.01•••• |
We found that the most common nephropathy origin was diabetic nephropathy (36.45%) followed by hypertensive nephropathy (24.56%) (Table II).
Table II
Nephropathy origins in the studied population
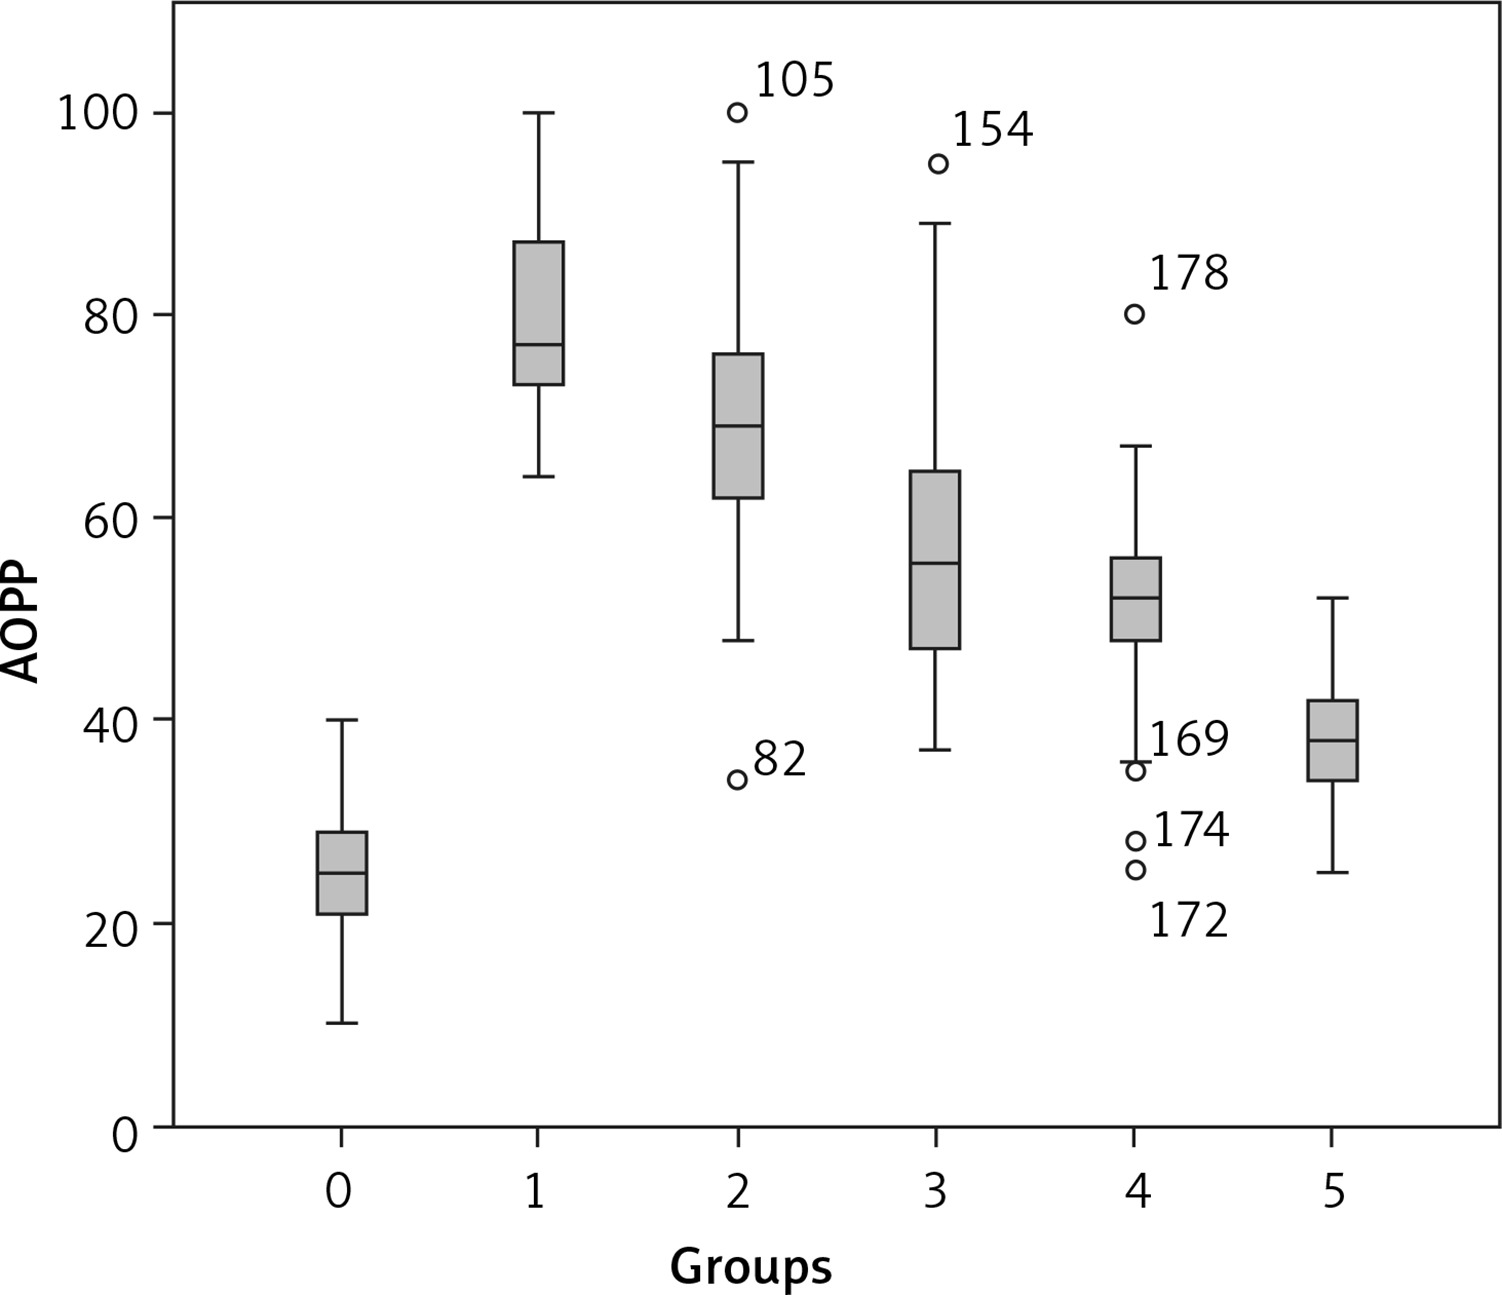
Oxidative stress markers including AOPP were measured in different groups of the studied population and the Tukey test for multiple comparisons revealed that AOPP levels increased with the degradation of renal function (Table I). The lowest values were recorded in the control group (24.92 µmol/l), whereas the highest values were seen in hemodialysis patients (78.82 ±12 µmol/l) (Figure 1).
A negative correlation was registered between AOPP and glomerular filtration rate (GFR), ca, cholesterol and HDLc, while the correlation was positive with PTH, triglycerides and CRPus (Figure 2).
Figure 2
Correlation of AOPP with the different glomerular filtration rate (GFR) (A), calcium (ca) (B), cholesterol (C), serum high-density lipoprotein cholesterol (HDLc) (D), parathyroid hormone (PTH) (E), phosphorus (F) and triglycerides (G)

The mean value of AOPP increased concomitantly with IM diameter (p < 0.05). Furthermore, the AOPP mean value was higher in patients with atheromatous plaques (p < 0.05) compared to those without plaques. Likewise, patients with vascular calcifications had higher AOPP levels than those without vascular calcifications (Table III).
Table III
Correlation of AOPP mean ± SEM values and atherosclerosis parameters in CKD patients
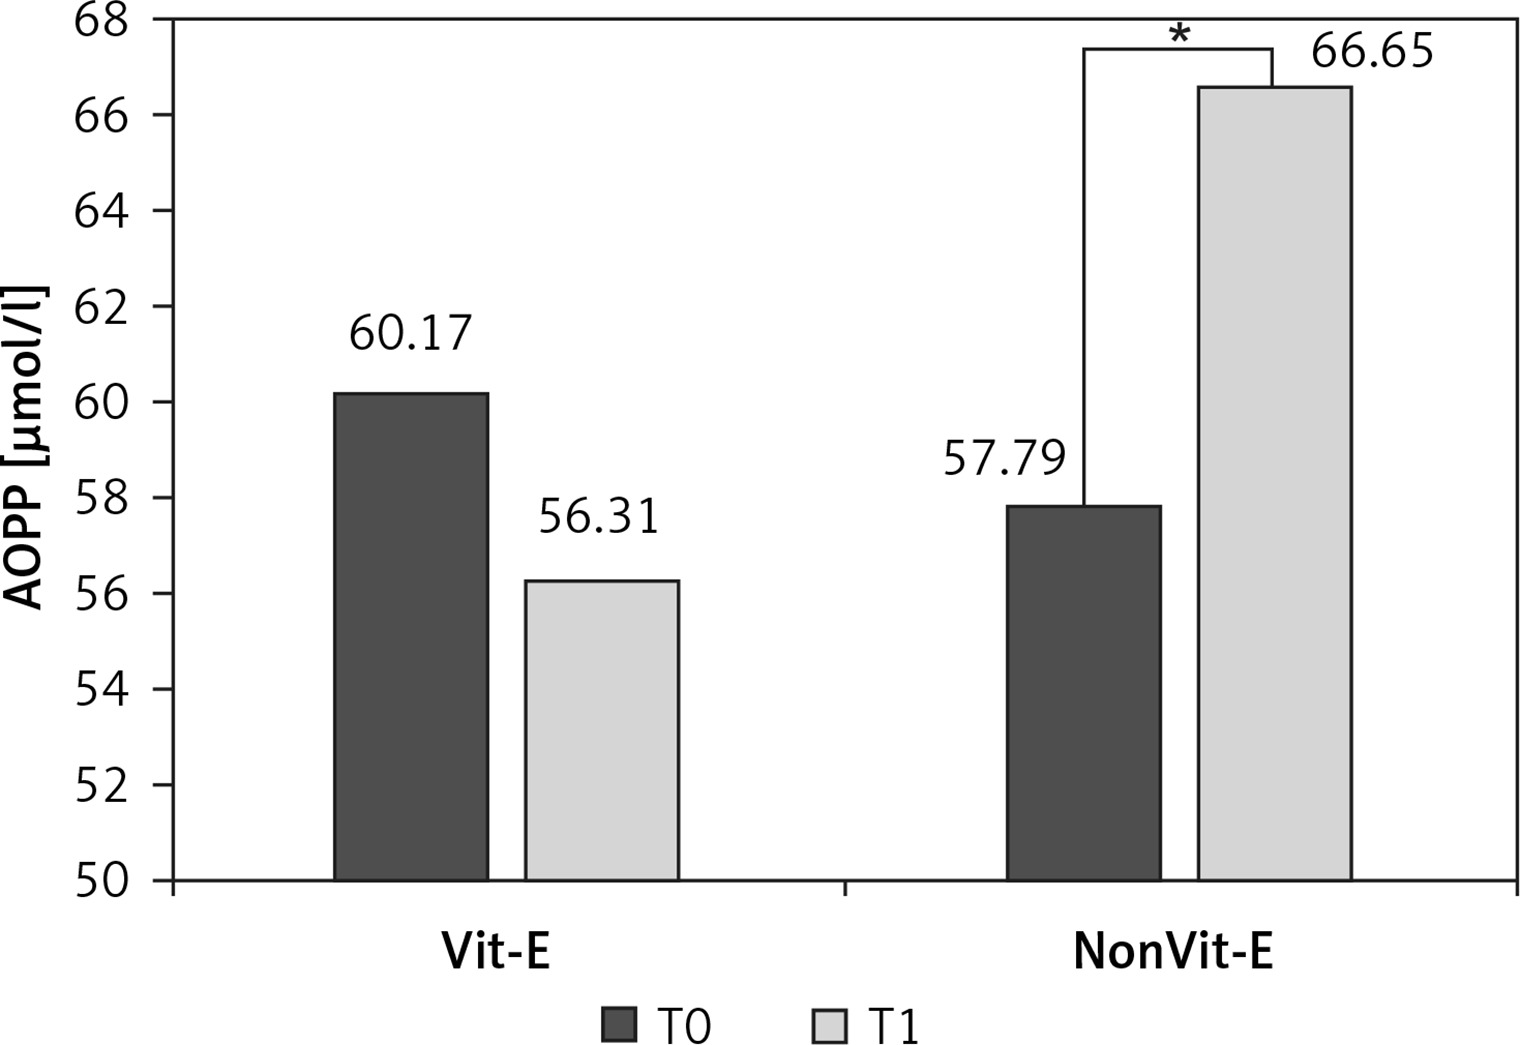
In the Vit-E supplemented group, mean ± SEM of AOPP slightly decreased after 2 years of treatment, but the difference was not significant (60.17 ±18.42 vs. 56.31 ±16.35 µmol/l, p > 0.05) (Figure 3). However, in the patients who did not receive Vit-E treatment, the mean value of AOPP increased significantly after 2 years (57.79 ±19.67 vs. 66.65 ±10.79 µmol/l, p < 0.01).
Figure 3
Evolution of AOPP levels in the Vit-E treatment and the non Vit-E treatment groups between the onset of treatment (T0) and after 2 years (T1). *Difference between the two times points was significant at p < 0.01
Regarding the evolution of atherosclerotic plaques in relation to Vit-E treatment, the difference between the onset of treatment and after 2 years of continuous treatment was not significant (46.66% vs. 44.66%, p > 0.05). Similar results were observed in the group that did not receive Vit-E treatment (43.56% vs. 45.56%, p > 0.05). There was no significant difference in survival curves between the group that received Vit-E treatment and the non Vit-E group (p > 0.05) (Figure 4).

Discussion
A longitudinal study was conducted on 205 patients with different stages of CKD. The sex ratio of the population is around 1.26 with a male predominance. The average age of the study subjects is 52 years, which represents a mature age.
Diabetic nephropathy represented the most frequent cause of CKD in the studied population. This common origin is mainly related to sedentary lifestyle, obesity and improvement in life quality of patients [17]. In our study, we excluded patients with significant cardiovascular co-morbidities in order not to interfere with AOPP levels, since the latter is high in patients with a history of cardiovascular disease [11].
Most diabetic patients have been on insulin. However, there have been no clear studies on the effect of insulin on AOPP, although there is a probable interaction given its effect on the patient’s blood sugar. On the other hand, most of the patients were were receiving Angiotensin-converting-enzyme inhibitors, which has a role in the reduction of AOPP [37].
We found that with increasing CKD stage the level of AOPP became higher. The lowest average level was found in stage 2 CKD patients (38.51 ±5.81 µmol/l), whereas the maximum average level was recorded in hemodialysis patients (78.82 ±10.01 µmol/l) (p < 0.0001). Our results agree with one of the first published works about AOPP [7]. In the latter study, AOPP were measured in 162 patients at different stages of CKD; the level was 42 ±2.6 µmol/l in patients with moderate CKD while hemodialysis patients had 72 ±4.4 µmol/l (p < 0.001). Likewise, Yang et al. [38] reported AOPP levels of 51.72 ±19.62 µmol/l in patients with moderate CKD while hemodialysis patients had 70.02 ±16.51 µmol/l.
During CKD following uremia, there is activation of two enzyme systems: NADPH oxidase and MPO, generating hydrogen peroxide which will peroxidize proteins and generate AOPP [6].
It seems that AOPP accumulation in the kidney is a multifactorial problem and their pathogenic role in renal lesions is diverse [39]. AOPP have been shown to bind to specific receptors of advanced glycation end-products (RAGE) on the surface of endothelial cells [12]. The AOPP-RAGE interaction could activate NAD(P)H oxidase, leading to ROS production, inducing apoptosis of podocytes through the p53-Bax pathway and leading to proteinuria, decreased creatinine clearance and glomerulosclerosis and interstitial fibrosis [40–42]. Furthermore, this interaction induces activation of renin-angiotensin by binding to CD36 receptors found in the tubular epithelium [36].
We noted in the study a positive correlation between the level of AOPP and that of triglycerides. It has been described in the literature that a high level of triglycerides increases the level of AOPP [43].
In the present study, a positive correlation between AOPP and CRPus levels was recorded. CRPus is considered as an inflammatory marker helping to predict cardiovascular complications, including atherosclerosis. Our results are consistent with the study conducted by Descamps-Latscha et al. [44] on 59 CKD patients, where a positive correlation between serum AOPP and CRPus levels was reported (r = 0.255, p < 0.05). Furthermore, AOPP could be involved in the pathogenesis of the micro-inflammation of chronic kidney disease by inducing increased expression of fibronectin and collagen I in mesangial cells and enhance vascular inflammation by stimulating pro-inflammatory mediators such as vascular-1 and intercellular-1 cell adhesion molecules [45, 46]. Therefore, the increase of AOPP and CRPus could reflect the progression of CKD stage and the degradation of renal function.
AOPP are generated from the reaction of plasma proteins with chlorinated oxidants through phagocytic cells which have myeloperoxidase, the only enzyme that is capable of generating chlorinated oxidants [6]. In uremic patients, the neutrophils formed by chronic inflammation have a high content of myeloperoxidase resulting in high oxidative stress and respiratory burst of monocytes as well as monocyte activation markers including neopterin, antagonist of IL-1R, TNF-α and TNF soluble receptors (TNF-sR55 and TNF-sR75) [7, 47]. Therefore, monocytes are considered as both the target and actor of immune imbalance associated with chronic uremia [48]. These inflammatory mediators might promote atherogenesis through LDL oxidation, leukocyte recruitment and proliferation of aortic smooth muscle cells (SMC) [49]. Likewise, AOPP are considered as pro-oxidant factors and inflammation mediators [50]. Therefore, increased oxidative stress and inflammation can further increase the formation of AOPP by stimulating leukocytes to produce more oxidants. This positive feedback loop could amplify or, at least, maintain oxidative stress and inflammation, thus contributing to atherosclerosis and atheroma formation [51].
Regarding the pro-atherogenic lipid markers, AOPP were positively correlated with triglycerides but negatively correlated with HDLc. Our results are consistent with those reported by Anderstam [52]. AOPP are pro-inflammatory mediators that directly disrupt HDL metabolism and therefore potentially increase the occurrence of cardiovascular disease [53]. Furthermore, HDL dysfunction and triglycerides accumulation in CKD patients had pro-inflammatory effects and stimulated the oxidative process and the formation of foam cells in the arterial wall, leading to atherosclerosis. Thus, a feedback loop is formed between lipid disorders and AOPP in CKD patients [54].
In the present study, AOPP were positively correlated with PTH and negatively with calcium, which is consistent with literature findings [55]. The increase in PTH levels leads to important intracellular accumulation of calcium and upregulation of ROS activity, mainly the AOPP. Thus, mitochondrial channels are widely opened, and mitochondria suffer from swelling and dysfunction, leading to cell necrosis [56]. Cardiac cells are the most affected, causing cardiac complications, mainly cardiac fibrosis, left ventricular hypertrophy and accelerated vascular atherosclerosis. Phosphocalcic disorders in CKD patients increase vascular stiffness and calcification [57]. Furthermore, AOPP levels were higher in patients with vascular calcifications compared to other patients, which explain the strong correlation between phosphocalcic disorders, AOPP and vascular calcification [58].
Patients with a high IM diameter had a higher level of AOPP compared to those with a normal IM diameter (73.84 ±12.31 µmol/l vs. 51.3 ±16.35 µmol/l, p < 0.05). These results confirm those reported by Yang et al. [38] where the AOPP levels were strongly related to IM diameter (r = 0.332, p < 0.01). Furthermore, patients with atheromatous plaques had higher AOPP levels compared to patients without plaques (63.18 ±17.57 µmol/l vs. 55.24 ±16.89, p < 0.01). This latter result is similar to a literature finding (73.87 ±19.40 µmol/l vs. 58.41 ±16.09 µmol/l).
It seems that AOPP accumulation worsens the process of atherosclerosis by three mechanisms: firstly, by inducing endothelial dysfunction and vascular inflammation [59]; secondly, by their role in lipid disorders [60]; finally, by promoting the formation of foam cells in macrophages, which represent a major step toward atheromatous plaque formation [61].
We found that patients with elevated AOPP levels were at greater risk of calcification of atheromatous plaques (55.94 ±17.46 µmol/l vs. 66. ±15.86 µmol/l, p < 0.01). According to Huaizhou You et al. [62], AOPP levels increased differentiation of osteoblastic cells and calcification of smooth muscle cells as well as promoting calcium deposits, which would aggravate vascular calcification.
Comparing the AOPP levels before the introduction of Vit-E treatment in CKD patients and after 2 years of continuous treatment revealed that the levels slightly decreased between the two time points but the difference was not significant (60.17 ±18.42 µmol/l vs. 56.31 ±16.35 µmol/l, p > 0.05). In the non Vit-E group, the AOPP levels significantly increased within the 2 years (57.79 ±19.67 µmol/l vs. 60.65 ±15.28 µmol/l, p < 0.05). Therefore, the Vit-E treatment could not reduce the AOPP level but has proved its effectiveness to stabilize it. Regarding atherosclerotic plaques, the difference in the AOPP levels was not significant between the two time points in the two groups. The survival curves for Vit-E and non Vit-E groups revealed that the death rates were not different after 2 years, meaning that Vit-E supplementation cannot improve chances of survival in CKD patients.
The influence of Vit-E treatment on the AOPP levels is not well documented. However, some authors reported no significant effect of the oral supplementation of Vit-E [30]. Likewise, hemodialysis patients benefited from dialysis membranes with Vit-E, and had consistent levels of AOPP [29].
The association of vitamin E with other vitamins, mainly vitamins C, A and β-carotene, was confirmed to be effective in decreasing oxidative stress and inflammation [63–65]. However, the effects of this combination on cardiovascular complications and morbidity were not confirmed [66, 67], except the association of vitamin E with polyunsaturated fatty acids (PUFA) or with some drugs such as aspirin and atorvastatin [26, 68, 69].
As alternative treatment, candesartan, an angiotensin II type 1 receptor blocker (ARB), has been shown to clinically reduce plasma AOPP levels [37]. Likewise, a cross-sectional study confirmed the efficacy of vitamin D in decreasing AOPP levels [70]. The major limitation of this study was the sample size; therefore, the collected data could not be representative of the general population. Furthermore, it was not possible to measure the correlation of AOPP with uremic toxins such as fibroblast growth factor 23 (FGF23). More evidence is needed to draw solid conclusions about the effect of Vit-E treatment on the level of AOPP as well as the process of atherosclerosis.
In conclusion, the AOPP levels increased with the degradation of renal function and inflammatory markers such as CRPus and other markers such as triglyceride, PTH and HDLc might accelerate the process of atherosclerosis in CKD patients. Furthermore, AOPP accumulation increased the occurrence of atherosclerotic plaques and their calcifications. Unfortunately, Vit-E had no significant effect on the process of atherosclerosis but stabilized the AOPP levels.