Introduction
The incidence of cancer is rapidly growing worldwide. This is due to both the aging and growth of the population, as well as changes in the prevalence of the main risk factors for cancer, several of which are associated with socioeconomic development [1, 2]. Prostate cancer ranks not only as the second most frequently diagnosed cancer, but also the fifth leading cause of cancer death in men, with an estimated 1.3 million new cases and 359,000 deaths worldwide in 2018 [3].
Little is known about prostate cancer aetiology, while important risk factors are age, race, positive family history of prostate cancer, and diet [4]. More specifically, 66 years considered is the average age of onset of this disease, while African-American is the race with the most frequent incidence of prostate cancer [5, 6]. Low socio-economic status is associated with increased incidence and mortality from cancer [7]. However, men with a high socioeconomic status (SES) have a higher incidence of prostate cancer than men with low SES [8–13]. This is probably due to different behaviour in the search for medical care [9, 10, 14–16]. However, prostate cancer mortality is not similar, and prostate cancer survival is poorer in men with lower SES [17–19]. Men with low SES may have a lower level of literacy and health awareness and may perceive cancer screening as more threatening, more difficult, and less beneficial [20]. In order to reduce cancer-preventable deaths, it is therefore important to examine factors related to non-attendance in prostate screening.
Prior studies have found increased risk of stroke in patients with cancer. More specifically, it has been found, according to autopsy data, that 15% of patients diagnosed with cancer have pathological evidence of cerebrovascular disease upon death [21], and several studies have demonstrated that stroke is common in patients with cancer [22–24]. The underlying mechanisms of stroke are related to cancer-mediated hypercoagulability or complications of oncological treatments [21, 22, 25, 26].
This work studies prostate cancer and stroke in the United States in the years 2007–2017 in order to find statistically significant predictors of cancer and a possible link between prostate cancer and stroke.
Material and methods
The data used in this work come from the National Health Interview Survey (NHIS) dataset [27] and cover the period 2007–2017. The target population for the NHIS is the civilian noninstitutionalized population of the United States. NHIS data are collected through personal household interviews. The main objective of the NHIS is to monitor the health of the U.S. population through the collection and analysis of data on a broad range of health topics. The number of adult patients with prostate cancer examined was 26,591.
Moreover, in the geographic classification of the U.S. population, states are grouped into four regions used by the U.S. Census Bureau:
Northeast: Maine, Vermont, New Hampshire, Massachusetts, Connecticut, Rhode Island, New York, New Jersey, and Pennsylvania.
Midwest: Ohio, Illinois, Indiana, Michigan, Wisconsin, Minnesota, Iowa, Missouri, North Dakota, South Dakota, Kansas, and Nebraska.
South: Delaware, Maryland, District of Columbia, West Virginia, Virginia, Kentucky, Tennessee, North Carolina, South Carolina, Georgia, Florida, Alabama, Mississippi, Louisiana, Oklahoma, Arkansas, and Texas.
West: Washington, Oregon, California, Nevada, New Mexico, Arizona, Idaho, Utah, Colorado, Montana, Wyoming, Alaska, and Hawaii.
Ethical approval
All procedures performed in studies involving human participants were in accordance with the ethical standards of the institutional and/or national research committee and with the 1964 Helsinki declaration and its later amendments or comparable ethical standards.
Statistical analysis
The statistical methods used to extract the results of this work are the χ2 test for categorical and one-way analysis of variance (ANOVA) for continues variables, to check the statistical significance of prostate cancer in relation to socio-economic characteristics of patients, such as age, race, origin, education, family income, poverty status, health insurance coverage, place of residence, and region. Factors that determine the prevalence of cancer were assessed by using multiple logistic regression analysis. To assess the predictors of cancer, we used data in patients with a new diagnosis of cancer compared to a matched cohort of patients without cancer. More specifically, the control group consisted of target population without cancer with the same socioeconomic characteristics as the patient group. The data were weighted before being analysed. Predictors were represented using the OR and 95% confidence intervals, and p < 0.05 was considered as statistically significant. The study was carried out using the IBMSPSS 25 software package for Windows.
Results
To check the zero hypothesis that the mean of the patients in the United States with prostate cancer did not differ according to their socio-economic characteristics, the χ2 test and One-way analysis of variance (ANOVA) were used. As shown in Table I, there was a statistically significant difference in the number of malignant neoplasms of the prostate in relation to age, and this occurred mainly in the age group of 75 years and over (41.5%), while the most common origin and race was Black or African American (70.4%), not Hispanic or Latino (48.7%). The education that was found to be statistically significant was “bachelor’s degree or higher” (36.3%). The employment status which was seen to statistically significant was “not employed but has worked previously” (57%). The poverty status that was seen to be statistically significant was “not poor” (80.3%), with a family income of $35.000 or more (40.9%). The health insurance coverage that was statistically significant in both age groups (under 65 years (81.4%) and 65 years and over (58.8%)) was private. In addition, the majority of prostate cancer patients had “married” marital status (72.9%). Finally, the region with the most frequent occurrence of prostate cancer was south (37.8%), with a population size of one million or more (48.9%).
Table I
Socio-economic characteristics of prostate cancer patients: United States 2007–2017 (χ2 and one-way ANOVA test)
Table II shows the multiple logistic regression analysis and odds ratios in order to find predictors for the occurrence of prostate cancer.
Table II
Socio-economic characteristics of prostate cancer patients: United States 2007–2017. Statistically significant predictors of prostate cancer in the US using multivariate logistic regression
As shown in Table II, all prognostic factors are statistically significant (p < 0.05). According to multiple logistic regression, the risk of prostate cancer is significantly higher in the age group of 75 years and over (OR = 1.0), Black or African American race (OR = 3.1), and “bachelor’s degree or higher” education status (OR = 1.0). Moreover, those who were not employed but have worked previously have 16 times the risk of developing prostate cancer (OR = 16.7). In addition, the risk of cancer is significantly higher with family income $35,000–$49,999 (OR = 1.2), poverty status “not poor” (OR = 1.0), health insurance coverage “other coverage” in both age groups – under 65 years and 65 years and over (OR = 24.0 and OR = 1.0, respectively). Widowed men have higher risk of developing prostate cancer (OR = 5.4). Finally, the risk of prostate cancer is significantly higher for region “Northeast” (OR = 1.2) and place of residence “not in metropolitan statistical area” (OR = 1.0).
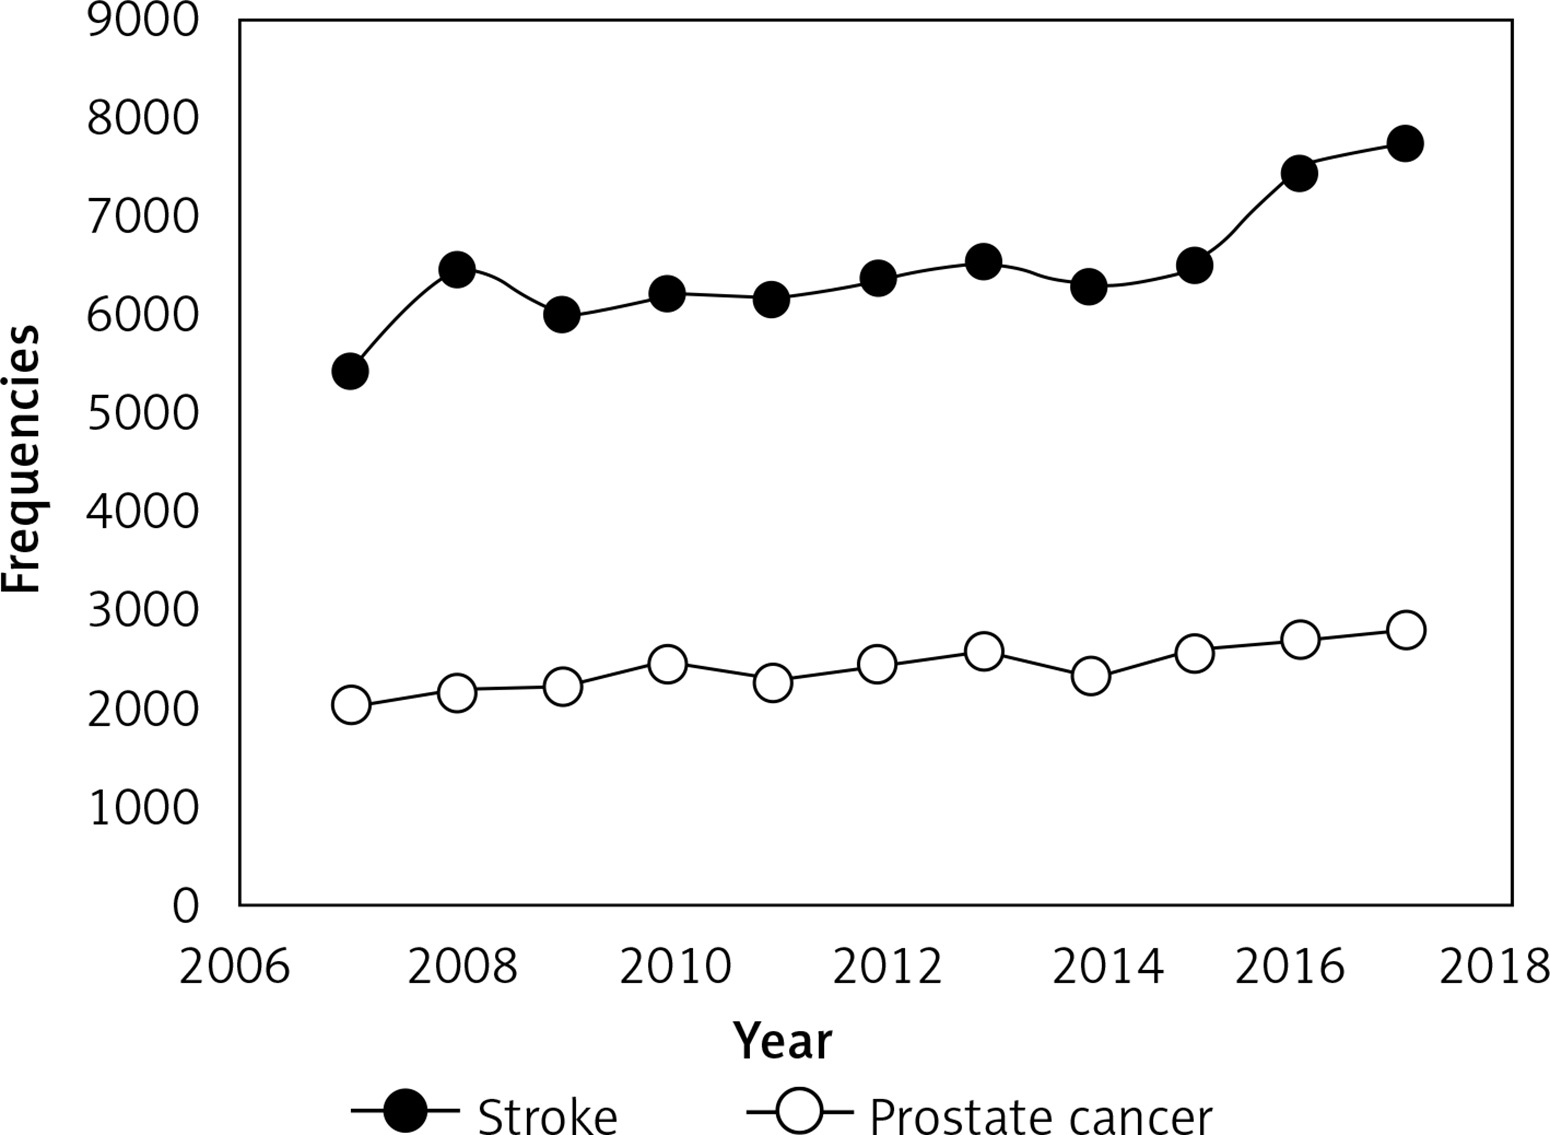
Figure 1 shows the trends in prostate cancer and stroke during the years 2007–2017 in the United States. The incidence of prostate cancer and stroke continued to increase from 2007 to 2017.
In order to find a possible link between prostate cancer and stroke, a multivariate logistic regression analysis was also used for stroke patients. As can be seen from Table III, marital status plays a crucial role in the incidence of stroke. Widowed adults have the highest risk for the occurrence of stroke (OR = 6.0). Family income and education are also prognostic risks for stroke. More specifically, family income “less than $35,000” (OR = 4.0) and “less than a high school diploma” education status (OR = 3.7) have four times higher risk for stroke. Finally, adults who were unemployed but had worked previously had two times the risk of stroke (OR = 1.9). Moreover, the risk of stroke was significantly higher with female gender (OR = 1.0), age over 75 years (OR = 1.0), and Black or African American race (OR = 2.4). The risk of stroke is significantly higher with poverty status “near poor” (OR = 2.0), health insurance coverage “other coverage” under 65 years old and “Medicare and Medicaid” over 65 years old (OR = 5.6 and OR = 1.3, respectively). Finally, the risk of stroke is significantly higher with region “south” (OR = 1.32) and place of residence “not in metropolitan statistical area” (OR = 1.0).
Table III
Characteristics of stroke patients: United States 2007–2017. Statistically significant predictors of Stroke in the US using multivariate logistic regression
Discussion
Increasing attention should be given to the prognostic factors that had the highest odds ratio. It is noted that the socio-economic characteristic of cancer patients with the highest risk is health insurance coverage, and more specifically it was found that men with “other coverage” had the highest risk of developing prostate cancer (OR = 24.0). Moreover, employment status plays a crucial role in developing this type of cancer. Men who were unemployed but had worked previously had a 16-fold increased risk of developing prostate cancer (OR = 16.7). Finally, marital status is a prognostic risk for this type of cancer, as widowed men were found to have a five-fold higher risk of developing prostate cancer (OR = 5.4).
It is also noteworthy that the socio-economic characteristics of stroke patients with the highest odds ratio were the same as those of prostate cancer patients. Deprivation of work and partner proved to be the primary prognostic risk factor for both stroke and prostate cancer, a fact that implies a possible link between cancer and stroke.
The importance of this study lies in the association of multiple socio-economic variables with cancer and stroke, which reflects the complexity and multidimensional nature of deprivation as well as the various roles of these dimensions during the course of life, which in turn reflects the longest gestation period for both cancer and stroke. More specifically, we found that partner and work deprivation, two determinants in the life of an adult, rapidly increase the risk of cancer as well as stroke. We also found that not only deprivation but also the death of a partner plays a key role in the increased risk of developing these two diseases.
In conclusion, this paper has highlighted that different socioeconomic variables are associated with different cancer risks, while deprivation (of work and partner) proved to be the primary prognostic risk factor for cancer. Moreover, the same factor proved to be the primary prognostic risk factor for stroke as well as for prostate cancer, a fact that implies a possible link between cancer and stroke.