Introduction
The coronary slow flow phenomenon (CSFP) finding of angiography in the absence of significant epicardial coronary disease is characterized by the delayed filling of the terminal vessels [1]. This phenomenon was first identified in 1972, but its exact etiology has remained unknown [2]. This phenomenon is clinically debilitating. About 80% of patients experienced recurrent chest pain that results in a reduction in their quality of life. Also, 20% of these patients require cardiac care unit (CCU) admission.
Corrected thrombosis in myocardial infarction (TIMI) frame count (CTFC) is a repeatable quantitative index of coronary artery flow that represents the full passage rate of the contrast media injected through the coronary arteries. CTFC indicates the required number of frames for contrast material to reach the standardized terminal coronary artery. Today, this method is the only CSFP diagnostic and evaluation tool, but its aggressiveness does not allow its use for clinical follow-up and long-term evaluation.
Total morphological and functional disorders of the small vessels and epicardial coronary arteries are involved in CSFP pathogenesis. Clinically, this phenomenon is widespread among young men and smokers who undergo angiography with suspicion of an acute coronary syndrome. The etiologies of CSFP include small vessel disease, microvascular vasomotor dysfunction, disseminated atherosclerosis, and endothelial dysfunction [3].
The vital role of the vascular endothelial layer in cardiovascular homeostasis is due to regulating vascular tone, structure, and function. The endothelium performs these actions through the controlled release of vasoactive substances. One of these essential compounds is nitric oxide (NO), which is produced by endothelial cells. NO is a small, lipophilic gas molecule made by nitric oxide synthase (NOS) from L-arginine [4].
NO has an essential role in regulating vascular tone, decreasing lipid levels, inhibiting expression of adhesion molecules, and platelet aggression in vascular smooth muscle cells. NOS is considered the only rate-limiting enzyme during the production of NO from L-arginine. Three isoforms of NOS are endothelial nitric oxide synthase (eNOS), neuronal nitric oxide synthase (nNOS), and induced nitric oxide synthase (iNOS). eNOS and nNOS are more expressed in physiological conditions, whereas iNOS is more expressed in pathological conditions [5]. The predominant NOS in the vascular structure is eNOS, which plays a critical role in the cardiovascular system [4]. Polymorphisms of the eNOS gene predispose the vasculature to atherosclerotic changes by decreasing NO bioavailability. In CSF, eNOS polymorphism causes endothelial NO production to become more impaired [6].
The exact mechanism in the pathophysiology of CSFP is not clear. Pathophysiological mechanisms of CSFP include endothelial injury due to increased homocysteine level and decreased NO level with elevated concentration of asymmetric dimethylarginine as a NOS inhibitor. Different ethnic groups have genetic variation regarding predisposition to CSFP. For example, there is a strong association between CSFP incidence and Glu298Asp gene polymorphism of eNOS in north Indian people and not in the Turkish population [7].
Given that angiography which is an invasive procedure is the only method of detecting coronary slow flow (CSF) and following up treatments, finding a relationship between NOS serum level and CSFP can help diagnose the dysfunction, follow up treatments and find new therapies for patients without the need for invasive procedures.
Material and methods
This study was conducted from July 2016 to October 2018 on patients attending the cardiology ward of Ghaem Hospital, affiliated to Mashhad University of Medical Sciences, Mashhad, Iran. Patients who were suspected of having coronary artery disease and were candidates for angiography were included, and patients undergoing hemodialysis, or had a history of coronary artery aneurysm, hyperhomocysteinemia, myocarditis, pericarditis, cardiomyopathy, and using sitagliptin were not included in the study. A total of 129 patients who underwent coronary angiography were included in this study. All patients had written informed consent. The Ethics Committee of Mashhad University of Medical Sciences approved this research (code number: IR.MUMS.REC.1395.314).
The visual findings of obstructive coronary artery disease and CSF arteries were detected by a cardiologist during the angiography.
“The corrected TIMI frame counts more than two standard deviations from the normal range without an obstruction in the coronary arteries” is the definition of slow blood flow of coronary arteries in this study (2). Table I shows the five groups of patients based on angiographic findings.
Table I
Study groups
| Patient groups | |
|---|---|
| Group 1 | CAD (–), CSF (–) |
| Group 2 | CAD (–), CSF (+) |
| Group 3 | CAD (+) (< 50%), CSF (–) |
| Group 4 | CAD (+) (> 50%, < 90%), CSF (–) |
| Group 5 | CAD (+), CSF (+) |
A list of demographic date including age and sex, history of smoking, history of previous illnesses (diabetes mellitus, dyslipidemia, hypertension, ischemic heart and cerebral diseases, and peripheral vascular diseases), family history of heart disease and patient’s angiographic findings were provided and completed for each patient. Then, a 20 ml sample of brachial vein blood was transferred to the Ghaem Hospital Emergency Laboratory to centrifuge at 3000 rpm. After centrifugation, the samples were transferred to a –80°C freezer for subsequent study phases.
At the end of the sampling phase, the NOS serum level was measured based on a standard protocol that included the preparation of reactors and standards for assaying.
In this process, by using calorimetric kits, NO, which is synthesized by the NOS enzyme, was subjected to a series of reactions and reacted with grease reactors 1 and 2 to produce a color product that had strong absorption at 540 nm.
It is worth mentioning that asymmetric dimethylarginine (ADMA) serum level was also measured in these blood samples and related data are published in another manuscript [8].
Statistical analysis
Statistical analysis was done using the software SPSS 22. Descriptive statistics, including mean and standard deviation or median, were used for normal and non-normal quantitative variables, respectively. We also used frequency percentages for qualitative variables, patients’ demographic characteristics, and other variables in the study for description. Then, analytical statistics were performed as follows.
First, the normality of quantitative variables distribution was evaluated by the Kolmogorov-Smirnov test. For variables with normal distribution, the independent t-test or ANOVA was used to compare the quantitative variables’ means in two or more independent groups, respectively. For non-normal distribution, the Mann-Whitney U test or Kruskal-Wallis test was used to compare the quantitative variables in two or more than two independent groups, respectively. When the ANOVA test rejected the hypothesis of equality of means, the existence of a significant difference of means was evaluated with Tukey’s multiple comparison test. The correlation of two variables in normally and non-normally distributed variables was analyzed by the Pearson and Spearman correlation coefficients, respectively. The level of significance for all tests was 0.05.
Results
A total of 129 patients who had undergone angiography entered the study. Of these, 51 (39.53%) were male and the mean age of the study population was 54.27 ±10.30 years.
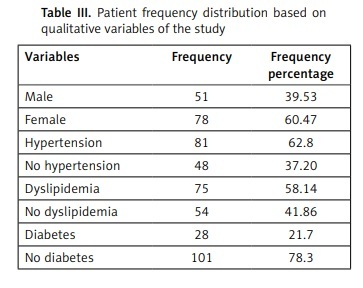
Table II indicates the mean and standard deviation of the quantitative variables studied and Table III shows the frequency distribution of patients in terms of qualitative variables.
Table II
Mean and standard deviation of the quantitative variables in the study population
| Variable | Minimum | Maximum | Mean ± standard deviation |
|---|---|---|---|
| Age [years] | 27 | 80 | 54.27 ±10.30 |
| Body mass index [kg/m2] | 17.6 | 40.9 | 28.10 ±4.74 |
| Fasting blood sugar [mg/dl] | 66 | 365 | 116.38 ±50.75 |
Table III
Patient frequency distribution based on qualitative variables of the study
| Variables | Frequency | Frequency percentage |
|---|---|---|
| Male | 51 | 39.53 |
| Female | 78 | 60.47 |
| Hypertension | 81 | 62.8 |
| No hypertension | 48 | 37.20 |
| Dyslipidemia | 75 | 58.14 |
| No dyslipidemia | 54 | 41.86 |
| Diabetes | 28 | 21.7 |
| No diabetes | 101 | 78.3 |
Frequencies of patient distribution in the five study groups
Among the 5 study groups, the highest frequency was related to patients without CAD and epicardial CSF (31%). The next most frequent group was patients with less than 50% CAD, and without CSF (22.48%). For patients with more than 50% and less than 90% CAD without CSF and patients without CAD and with CSF, the frequency percentages were both 17.05%. Finally, patients who had CAD and epicardial CSF were in a group with a frequency percentage of 12.40%.
Frequencies of numbers of involved vessels in patients with CAD
The frequencies of the numbers of involved vessels in 22 cases of CAD (between 50 and 90%) were determined. Accordingly, involvement of one coronary artery had the highest frequency in cases with CAD (36.36%). Both patient groups with two or three vessel disease had a frequency percentage of 31.81%.
Serum concentration of NOS in the five groups
As can be observed in Table IV, the serum concentrations of NOS were not significantly different among study groups (p = 0.488). However, the patient group without CAD and with CSF had lower mean serum concentration of NOS than the other groups.
Table IV
NOS mean serum concentration in five study groups
| Group | NOS serum concentration (mean ± standard deviation) | P-value* |
|---|---|---|
| CAD (–), CSF (–) | 4.54 ±4.12 | 0.488 |
| CAD (–), CSF (+) | 3.89 ±2.66 | |
| CAD (+) (< 50%), CSF (–) | 5.01 ±4.05 | |
| CAD (+) (> 50%, < 90%), CSF (–) | 5.48 ±4.97 | |
| CAD (+), CSF (+) | 6.13 ±4.69 |
NOS serum concentration based on cardiac risk factors
NOS mean serum levels with or without the risk factors including hypertension, diabetes mellitus, dyslipidemia, smoking, and age are shown in Table V. Based on available data, no significant differences in the NOS mean serum levels were observed between patients with or without the above-mentioned risk factors.
Table V
NOS serum concentration based on risk factors
| Group | NOS serum concentration (mean ± standard deviation) | P-value* |
|---|---|---|
| With hypertension | 5.07 ±4.19 | 0.455 |
| Without hypertension | 4.49 ±4.02 | |
| With diabetes mellitus | 5.32 ±4.70 | 0.511 |
| Without diabetes mellitus | 4.72 ±3.96 | |
| With dyslipidemia | 4.74 ±4.06 | 0.736 |
| Without dyslipidemia | 5.00 ±4.23 | |
| With smoking | 4.51 ±3.53 | 0.500 |
| Without smoking | 5.05 ±4.37 | |
| With age risk factor | 4.63 ±3.88 | 0.417 |
| Without age risk factor | 5.25 ±4.45 |
According to age and gender, patients were classified into two groups. Age over 45 in men and over 55 in women were considered as age risk factors for heart disease. Also, men under 45 and women under 55 were considered as patients without age risk factors for heart disease. NOS mean serum levels were not significantly different based on the age risk factor.
NOS serum concentration in groups with different body mass index (BMI)
The four groups of patients based on BMI were as follows: group one with BMI less than 25, group two with BMI between 25 and 26.9, group three with BMI between 27 and 29.9, and group four with BMI more than or equal to 30. The NOS mean serum level in patients with different BMI was not significantly different (p = 0.250).
Relation of NOS serum concentration and CTFC-based CSF intensity
The amount of CTFC in left circumflex (LCX), left anterior descending artery (LAD), and right coronary artery (RCA) of patients with CSF was measured separately for each vessel. Given that in some patients, there were two or three coronary arteries with slow flow, the mean CTFC was calculated for these patients.
Table VI shows no significant correlation between the NOS serum level and CTFC-based slow flow intensity in coronary arteries and for each LAD, RCA, and LCX vessel, separately.
Table VI
Relation of NOS serum concentration and CTFC-based CSF intensity
| Variable | Correlation coefficient | P-value* |
|---|---|---|
| Mean CTFC in coronary arteries | 0.230 | 0.172 |
| CTFC in LAD artery | 0.311 | 0.100 |
| CTFC in RCA artery | 0.109 | 0.656 |
| CTFC in LCX artery | 0.216 | 0.388 |
Discussion
The angiographic finding called CSFP can cause angina during rest or exercise, acute myocardial infarction, and hypertension [9]. Also, independent risk factors for coronary artery slow flow phenomenon are hypertension, dyslipidemia, cigarette smoking, and tobacco consumption [1].
NO plays an essential role in regulating vascular tone, decreasing lipid levels, and inhibiting the expression of adhesion molecules and platelet aggregation in the smooth muscle of vessels [5]. The present study investigated the NOS concentration in patients with or without CAD and coronary artery slow flow.
Pekdemir et al. performed a study on 33 patients with CSF and 19 patients in the control group with normal coronary flow. Based on the results of the exercise test, patients with CSF were further classified into two groups. Eight people had positive exercise tests, and twenty-five had negative exercise tests. In this study, the NO plasma level was not significantly different in patients with CSF who had positive or negative exercise tests. However, the CSF group with a positive exercise test had a significantly lower plasma level of NO (23.4 ±13.5 µmol/l) than the control group (42.5 ±15.9 µmol/l). Also, in this study, TIMI frame count had a significant relationship with NO concentration (r = –0.3 and p < 0.05) [10].
In another study on 50 patients with CSF and 30 patients with normal coronary flow, the CSF group had a significantly lower mean NO plasma level (11.4 ±6) than the control group (16.1 ±9) (p = 0.02). Also, mean TIMI frame count had no significant relationship with plasma NO concentration (r = –0.18, p = 0.13) [11].
In our study, NOS mean serum concentration was not significantly correlated with mean CTFC-based CSF intensity in coronary arteries. However, other factors have a role in the pathogenesis of CSF. Also in our study since the total amount of NOS was measured as a result of three isoforms of this enzyme, the lack of correlation could be related to the increased iNOS level and decreased eNOS concentration. Consequently, there was no change in the total amount of NOS in these patients.
Hypertension is a complex cardiovascular disease that affects about one billion people in the world. Hypertension is a preventable risk factor for vascular events such as stroke and CAD and many pathophysiological mechanisms involved in this disease. NO depletion has been evaluated as an important factor in hypertension [4]. Endothelial dysfunction, inflammation, vasoconstriction, and apoptosis as consequences of insulin resistance may increase atherosclerosis incidence and extension [12]. Also, articles have suggested that reduced NO bioavailability is correlated with diabetes mellitus occurrence. Numerous studies have also investigated the relation between eNOS polymorphisms and diabetes mellitus. Disorders in NO buildup have been involved in the pathogenesis of retinopathy and diabetic nephropathy due to chronic hyperglycemia [4].
Obesity is a considerable risk factor for type 2 diabetes and cardiovascular diseases [13]. The obesity prevalence in adults increased from 13% to 36% between 1962 and 2010 and has doubled over the last two decades. Also, the risk of developing type 2 diabetes in overweight and obese people is 3 to 7 times higher than in normal subjects [14]. Bioavailability of NO in animal models in which obesity is induced by diet and also in obese and insulin-resistant patients has been reduced. In addition, increased NO output significantly affects obesity and insulin resistance. Since NO bioavailability is dependent on the balance between its buildup and metabolism, reduced levels of NO in the condition of obesity could be due to decreased expression of NOS, impaired NOS activity, or the reaction of NO with reactive species such as superoxide. NO derived from eNOS has both anti-obesity and anti-insulin resistance roles. The anti-obesity role of NO is related to its ability to increase lipid oxidation in peripheral tissues such as adipose tissue, liver and, skeletal muscle. The effect of eNOS on glucose metabolism sensitivity is related to its ability to increase insulin and glucose transport to target peripheral tissues such as skeletal muscles and to regulate gluconeogenesis [15].
Smoking as a risk factor was also evaluated in our study. Smoking is considered as a significant risk factor for atherosclerosis, cerebrovascular disease, CAD, hypertension, and diabetes mellitus. Chronic smoking can impair endothelial function by reducing NO buildup and increasing NO change through the buildup of free oxygen radicals. Disruption of endothelium NO buildup and increased production of reactive oxygen species such as superoxide anions through the reduction of BH4 and NADPH diaphoresis activity are involved in the smoking-induced pathogenesis [16]. Smoking is also considered as one of the risk factors that accelerate inflammatory processes [17].
In our study, NOS serum level had no significant correlation with cardiovascular risk factors and BMI changes, which could be related to NOS instability. The results of our study did not demonstrate the role of NOS in cardiovascular diseases and related risk factors. The relatively small population size and the non-cooperation of some patients were the limitations of the study. This is the first study to evaluate the epicardial CSF correlation with the NOS concentration in five groups of patients as one of the strong points of the study. We suggest performing further human studies for better determination of the relationship between these parameters.