Introduction
Cytokines are synthesized and released by immune system cells and mediate critical immune responses. The pro-inflammatory cytokines perform a major function in mediating several pathophysiological responses, and their serum concentrations may reflect the effectiveness of the immune system. A series of anti-inflammatory cytokines in part determine the regulation of pro-inflammatory cytokines. Growth factors, released by various cell types, have extensive biological effects and generally act in an autocrine or paracrine manner [1–5].
Aging is associated with increased serum levels of some pro-inflammatory cytokines. For instance, intracellular T-cell tumour necrosis factor (TNF)-α and interleukin (IL)-6 levels are significantly higher in the older age groups [4, 6]. Women have higher serum concentrations of inflammatory markers, which may be associated with a more significant immune response than men [7]. Furthermore, women of all ages demonstrate considerably lower infection rates than men [8–10].
Weight loss is frequently associated with reduced concentrations of serum inflammatory markers. Inflammatory cells are found at higher levels in the adipose tissue of obese individuals, and weight loss is associated with changes in inflammation-associated genes and the resultant markers in adipose tissue. Weight loss decreases the production of inflammatory cytokines in the adipose tissue of obese individuals and leads to a concomitant increase in expression of anti-inflammatory factors [11–14].
Height, alone or with weight and age, is a factor associated with serum concentrations of biomarkers of immunity and inflammation [15–17]. A positive correlation was found between body mass index (BMI) and serum concentration of these biomarkers, suggesting that obesity is associated with the storage of macrophages in adipose tissue [18]. The secretion of high concentrations of inflammatory cytokines and other mediators from adipose tissue is associated with increased insulin resistance and resultant high blood glucose concentration. This may be through their effects on the nuclear factor-κB (NF-κB) pathway [19, 20].
A positive correlation between the concentration of several cytokines and blood pressure has been reported; higher cytokine concentrations may be related to the underlying causes of hypertension through the effects of inflammatory responses or as an independent aetiology for hypertension [21].
The components of the lipid profile may have a modifying effect on inflammation. High-density lipoprotein (HDL) cholesterol (C) and especially apolipoprotein (Apo) AI have anti-inflammatory properties. Apo AI can inhibit IL-1 and TNF-α expression. Low plasma HDL-C levels are reported to be related to a higher sensitivity towards inflammatory stimuli, with a subsequent increase in inflammatory responses after endotoxin challenge in humans [22–25].
In the present study, we aimed to clarify the relationship between the serum level of pro and anti-inflammatory cytokines and growth factors and demographic, anthropometric, and biochemical measurement in healthy subjects.
In general, these factors are divided into 3 categories of pro-inflammatory cytokines, anti-inflammatory cytokines, and growth factors [26]. Pro-inflammatory cytokines include IL-1β and IL-1α, IL-2, IL-6, IL-8, TNF-α, and MCP-1 [27, 28]. IL-10, IL-4, and interferon-γ (INF-γ) are considered to be anti-inflammatory cytokines [29, 30]. Epithelial growth factor (EGF) and vascular endothelial growth factor (VEGF) are growth factors [31].
Material and methods
Study population
A total of 103 participants were recruited using a population-based cluster sampling from Mashhad city, Iran. They had no history of known systemic inflammation or infectious diseases and were without any personal history of diabetes mellitus, myocardial infarction (MI), or stroke. Individuals with other abnormal/risky medical conditions, including endocrine abnormalities, smoking, diabetes, hypertension, obesity (BMI ≥ 30 kg/m2), pregnancy, and lactation, were excluded. Participants taking any drugs or consuming alcohol were also excluded.
Written informed consent was obtained from all study participants. The study was approved by the Ethical Review Board of Mashhad University of Medical Sciences.
Collecting anthropometric data
Anthropometric parameters, including waist and hip circumference (WC and HC), were measured using standard procedures. Systolic and diastolic blood pressure (SBP and DBP) were measured in duplicate by sphygmomanometer using the left arm with the individual seated and after 15 min of rest.
Blood sampling
After 12-hour overnight fasting, blood samples (20 ml) were collected in plain tubes and centrifuged at room temperature and 1500 g for 20 min. We measured blood glucose, and lipid profile (i.e. total cholesterol (TC), triglyceride (TG), and HDL-C) using an auto-analyser system and routine methods (Eppendorf, Germany). If the TG level was < 400 mg/dl, LDL-C was calculated using Friedewald’s equation [32, 33].
Measurement of serum cytokines levels
Serum cytokine levels were determined using an EV 3513 cytokine biochip array (Randox Laboratories, Crumlin, UK) using sandwich and competitive chemiluminescence immunoassay methods (Randox Laboratories, Crumlin, UK) [34–36].
Statistical analysis
Data analyses were done using SPSS version 11.5 for Windows. The correlations were assessed using Spearman correlation analysis. A multivariate analysis model with a stepwise method was used to examine associations between the serum concentration of pro- and anti-inflammatory cytokines and the determinant factors with p < 0.05 in univariate analysis. At first, the univariate regression was performed then the variables with p < 0.05 in this analysis were further analysed using multivariate regression.
Results
Anthropometric features of participants
Overall, 103 healthy subjects (62 females and 41 males) with a mean age of 47.9 ±11 years were recruited in this study. The main baseline parameters of the study subjects are reported in Table I. SBP and DBP were 111.3 ±25.2 and 74.9 ±16.8 mm Hg, respectively. Mean serum TC, TG, HDL-C, and LDL-C were 188.1 ±36.3, 130.9, 42.8 ±8.2, and 117.4 ±27.8 mg/dl, respectively. Mean FBG was 87.8 ±14.4 mg/dl. Mean WC and HC were 91.5 ±8.8 and 100.6 ±6.5 cm, respectively. Our participants’ mean height was 1.61±0.07 m, and the mean weight was 65.36 ±9.4 kg (Table I).
Table I
Baseline information of the study population
[i] Values are presented as mean ± SD, and median (interquartile range) for normally and non-normally distributed variables, respectively. HC – hip circumference, WC – waist circumference, FBG – fasting blood glucose, SBP – systolic blood pressure, DBP – diastolic blood pressure, TG – triglyceride, TC – total cholesterol, HDL-C – high-density lipoprotein cholesterol, LDL-C – low-density lipoprotein cholesterol, BMI – body mass index.
Cytokines assay and associated factors
A panel of 12 cytokines were evaluated in healthy participants. Table II shows the median and interquartile range for the 12 measured cytokines.
Table II
Median concentration of serum cytokines in the study population
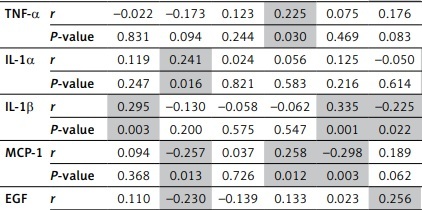
As shown in Table III, Spearman correlation analysis revealed a significant negative correlation between anti-inflammatory cytokines (such as IL-10 and IL-4) and markers such as IL-8, MCP-1, VEGF, and EGF in the healthy population (p < 0.05). The pro-inflammatory cytokines, such as IL-1β, were also correlated with IFN-γ and IL-2 (p < 0.05).
Table III
Correlation between inflammatory and anti-inflammatory cytokines and growth factors in the healthy subjects
[i] The results are represented with (r) the correlation coefficient and p-value. The statistically significant correlations are highlighted, and correlation is significant at the level of 0.05 (2-tailed). INF γ – interferon γ, EGF – epidermal growth factor, VEFG – vascular endothelial growth factor, IL – interleukin, MCP-1 – monocyte chemoattractant protein, TNF-α – tumour necrosis factor.
According to Table IV, FBG was positively associated with serum IL-2, IL-4, and IL-1α, and IL-4 was positively associated with age (p < 0.001). There was a positive association between EGF serum concentrations and age (p < 0.001). Serum IL-8 was negatively associated with SBP (p = 0.002) and sex (p = 0.028).
Table IV
Associated factors of serum cytokine levels using stepwise linear regression models
[i] Effective factors on serum cytokines level were identified by using stepwise linear regression models. The stepwise models were run as multivariate in present of age, sex, total cholesterol, triglyceride, HDL, LDL, FBG, BMI, SBP, DBP, waist circumference, and hip circumference. None of the stepwise regression models was significant for MCP-1, IL-10, and IL-6. FBG in mg/dl.
There were positive associations between serum levels of VEGF and HDL (p = 0.007). Positive associations were observed between IFN-γ and TNF-α and serum TG (p = 0.018 and 0.006, respectively). However, there was a positive relationship between serum IFN-γ and IL-1β level and HC (p = 0.029 and 0.001, respectively). MCP-1, IL-10, and IL-6 showed no association with variations in the assessed factors.
Discussion
The serum concentrations of pro- and anti-inflammatory cytokines and growth factors were variably associated with individual anthropometric and biochemical characteristics [37, 38].
In this study, FBG was positively associated with pro-inflammatory cytokines. Various animal studies have provided insights into the potential roles of pro-inflammatory cytokines in the metabolism and homeostasis of glucose, possibly through stimulating the secretion of counter-regulatory hormones or interfering with insulin functions [39–44].
Clinical trials assessing these cytokines in the metabolism of glucose are limited. An interventional study on 7 healthy male subjects found that etiocholanolone, an agent that induces systemic inflammatory responses mediated by IL-1, led to increased plasma activity of IL-1 but did not affect glucose and insulin levels [45]. Moreover, a study on 21 women with recurrent ovarian cancer treated with IL-1α revealed that administration of IL-1α did not increase the serum cortisol levels in the serum of these patients [46].
In another study, Harnish et al. tested the hypothesis that the pro-inflammatory cytokines involved in the acute-phase reaction to infection and regulating the dynamics of human host defence can be involved in regulating blood glucose well. They found that the injection of IL-2 in healthy men induced a transient but prominent decrease in glucose levels, without any change in insulin, C-peptide, or cortisol concentrations. Inconsistently, they observed that IL-6 resulted in an increased cortisol level, followed by a significant increase in blood glucose. Their findings suggest a differential regulation of the glucose level by inflammatory cytokines [47].
There was a significant correlation between IL-1β and hip circumference among our subjects, which might be related to the role of IL-1β in the regulation of lipid metabolism or the accumulation adipose tissue macrophages of obese patients [18, 48]. Also, Speaker and Fleshner reported an increased level of IL-1β in subcutaneous (compared to visceral) adipose tissue and disproportionate shunting of circulating energy substrates to visceral adipose tissue for storage, resulting in visceral obesity [49].
We also found a positive association between age and IL-4. This age-related increase in the level of pro-inflammatory cytokines might be because older people are more likely to have a subclinical inflammatory disease. Another possible reason for the increased secretion of IL-4 is the exposure of immune cells to various microorganisms, leading to many inflammatory processes, which indubitably result in higher inflammatory cytokines [4, 6, 50].
In the present study, we observed negative associations between IL-8 and factors of female sex (β-coefficient = –3.994; 95% CI = –7.536 to –0.452) and SBP (β-coefficient = –0.098; 95% CI = –0.160 to –0.036), both of which were statistically significant (p-values were 0.028 and 0.002, respectively).
Boekholdt et al. studied the relationship between IL-8 plasma levels and future coronary artery disease risk in healthy individuals. They found a significant positive association between the serum concentration of IL-8 and age in male subjects (p < 0.0001). Their results indicated no significant difference between the 4 quartiles of serum IL-8 concentration regarding SBP, lipid profile, BMI, CRP, diabetes, and leukocyte count [51].
We found that VEGF is significantly associated with HDL-C (p = 0.007). Although HDL-C is generally thought to be an anti-atherosclerotic agent, a previous study revealed that it could activate Jun N-terminal kinase (JNK)-1, triggered initially by environmental stress, resulting in inhibition of the formation of vascular tubes by endothelial cells. JNK-1 acts through 2 mechanisms, one of which is inhibiting the secretion of VEGF from smooth muscle cells. This scenario is a possible reason for our findings [52]. However, another study suggested that VEGF-A, as an endogenous inhibitor of endothelial lipase, could increase systemic HDL-C and play a key role in atherosclerosis [53].
We also found that the IFN-γ levels were positively associated with the serum level of TG and hip circumference (p = 0.018 and 0.029, respectively). Hao et al. conducted a study in which they investigated the effect of high mobility group box-1 (HMGB1) on lipogenesis and lipid deposition in IFN-γ-stimulated mouse mesangial cells. They found that lipid accumulation and concentration of triglyceride content were increased in the HMGB1-stimulated group. This explains the increase in hip circumference and the rise of TG serum concentration by an increase in IFN-γ serum level among our subjects [54].
We found that serum levels of TNF-α were positively associated with TG serum concentration (p = 0.006). Our results in this regard are in line with the results of Bruunsgaard et al., who observed significantly higher TG concentrations among subjects with high TNF-α serum level, compared to those with low TNF-α serum level [55]. Kim et al. found the adipose tissue triglyceride lipase (ATGL), the enzyme that selectively regulates lipolysis of TG, to be down-regulated by TNF-α [56]. Also, Grunfeld et al. reported increased TG secretion by TNF-α-stimulated cultured hepatic cells into the media [57].
We found a strong positive association between EGF and age among our subjects (p < 0.001), which might be due to cellular aging and the consequent down-regulation of EGF receptors, resulting in compensatory elevation of serum EGF levels [58]. There was an age-related reduction in the expression of EGF receptor-related protein (ERRP) in the colonic mucosa of aged rats [59].
Our results indicate a possible association between various pro- and anti-inflammatory cytokines and growth factors and age, sex, anthropometric and biochemical factors, which are among the defining components of various metabolic disorders. In conclusion, evaluating the level of circulating cytokines is a potential prognostic strategy in assessing metabolic disorders.