Introduction
Hypertension is one of the most prevalent diseases in the world, accounting for 9.4 million deaths each year [1]. This condition is often associated with metabolic disorders as well as functional and structural alterations of target organs. Furthermore, it is aggravated by the presence of other risk factors such as dyslipidemia, abdominal obesity, glucose intolerance, and diabetes [2].
Because of its high prevalence and multifactorial etiology, it is important to understand the dynamics of the risk factors associated with hypertension, especially the hereditary component, which might explain approximately 45% of all cases of high blood pressure (BP) [3]. Thus, research interest regarding identification of the genetic polymorphisms associated with hypertension has grown [4]. These polymorphic differences include those of the gene of the endothelial nitric oxide synthase (eNOS) enzyme, which is involved in the production of nitric oxide (NO) from the oxidation of L-arginine. The NO is a free radical that acts in the vasodilation process and regulation of vascular tone [5, 6].
In knockout animal models in which genetic manipulation was performed to inhibit expression of the eNOS gene (eNOS-KO), an increase in BP levels was observed, demonstrating the importance of NO in the regulation of blood pressure [7, 8].
In addition to BP control, NO is also related to lipid metabolism via inhibition of LDL oxidation and the platelet aggregation resulting from this oxidation [9]. Thus, NO is an important protective factor against the progression of cardiovascular diseases [10].
Of the polymorphisms associated with the eNOS gene, G894T is the most scientifically relevant because it has been recognized as an important risk factor regarding the increase of BP levels and the occurrence of other diseases such as coronary artery disease, vascular diseases, acute myocardial infarction, metabolic syndrome, and type 2 diabetes [11]. In a study of Caucasian individuals from the Iberian peninsula, Goni et al. found a significantly higher DBP of 1.99 mm Hg in the people with the GT or TT genotypes compared with those with the GG genotype [12].
Therefore, the G894T polymorphism, by directly influencing eNOS gene expression, is an important biomarker for the development of hypertension [9]. However, no studies have described the distribution and association of the G894T polymorphism with regard to hypertension in women from northeast Brazil, a region characterized by greater social vulnerability and (in relation to the South/Southeast regions) the worst social indicators in the country. This investigation is important because gene expression can be strongly influenced by environmental factors [13].
In addition to the environmental question, hypertension has different effects according to gender, as noted by the National Health Survey in 2013, which observed a higher prevalence of hypertension among women (24.2% vs. 18.3%) [14].
The present study sought to characterize the distribution of the G894T polymorphism of the eNOS gene in a population of women from northeast Brazil and investigate its association with hypertension.
Material and methods
This is a cross-sectional study involving a representative sample of women from Alagoas, a state in northeastern Brazil, whose general population is estimated at about three million inhabitants [15].
For the sample size calculation, the variable of interest was hypertension, whose prevalence in Brazilian adults was estimated to be 23.3% [16]. Given a population of 718,493 women aged 19 to 49 years, a sample error of 3.0%, and a confidence interval (CI) of 95%, the study would require a sample of 762 women. To cover any potential sample losses, an additional 10% was added to this number. Thus, the planned sample was 838 women. The calculations were performed using the StatCalc module of Epi Info 7.1.4 (CDC, Atlanta, USA).
To attain the required number of women, a multiple stage process was adopted across four steps. In the first stage, 30 of the 102 municipalities in Alagoas were selected via random sampling with a probability proportional to the number of inhabitants. Because of its larger population, Arapiraca was selected twice, and Maceió, the state capital, which contains a third of the population of Alagoas, was sampled ten times. In the second step, four census tracts per municipality were chosen via a simple drawing, respecting the proportion between urban and rural sectors. For the cities of Maceió and Arapiraca, the census sectors were organized in a list, and the drawing was performed using systematic sampling. In the third step, one block in each census tract was randomly selected; finally (step 4), a starting point (i.e., a corner) in each block was randomly chosen, from which seven consecutive households were visited moving in a counterclockwise direction. Women aged 20 to 49 years old who resided in the selected households were eligible for this study.
Dependent variable
The dependent variable was systemic hypertension. BP was measured in duplicate, with the individual seated after 15 min of rest using Omron HEM-7113 digital BP monitors (Omron, Tokyo, Japan). Systemic hypertension was diagnosed when systolic BP (SBP) was ≥ 140 mm Hg, diastolic BP (DBP) was ≥ 90 mm Hg, when the patient reported the use of antihypertensive medications, or some combination thereof [17].
Independent variable
The independent variable was the G894T polymorphism of the eNOS gene according to the GG, GT, and TT genotypes.
During the household visits, the women were invited to be present the next day at a predetermined location near their household (a basic health unit or a school, for example), where, in addition to biochemical tests, oral mucosa cells were collected. The patients were instructed to pre-rinse with 100 ml of distilled water, and the collection was performed by scraping the inner cheeks with small sterile cytology brushes, making approximately 30 circular movements. The outer portions of the brushes were cut and placed in 2-ml microtubes. The samples obtained were stored in a refrigerator for subsequent DNA extraction with NaCl [18]. The DNA was then quantified using a spectrophotometer. After extraction and quantification, the DNA samples were stored at –24°C until genotyping was performed.
The 894G>T (rs1799983) polymorphism has the sequence TTCCTGCTGCAGGCCCAGTGA[G/T]CCCCCAGAACTCTTCCTTCTGCCC and was genotyped using the TaqMan Genotyping Assay method (Applied Biosystems, Foster City, CA, USA). PCR reactions were performed with 5.0 μl of 2X TaqMan Genotyping Master Mix, 0.125 μl of TaqMan 40X Assay, and 4.87 μl of 4 ng/μl DNA to a final volume of 10 μl. The amplification parameters consisted of 95°C for 10 min, followed by 40 cycles at 92°C for 15 s, and 60°C for 1 min using the Step One Plus Real-Time PCR System (Applied Biosystems, Foster City, CA, USA). Individual genotypic discrimination was performed using Step One Plus software, version 2.3, at the end of each reaction. Positive controls and negative controls were used to avoid possible contamination for all reactions.
Covariates (variables analyzed to control for confounds, to characterize the sample, or both)
The following variables were obtained: age; location of residence (rural or urban); employment; schooling; skin color/ethnicity; parity; beneficiary of the “Bolsa Família” Program; access to health services (public or private); and food security status; prevalence of disease over the last 15 days; regular alcohol consumption; smoking status; physical activity level; regular consumption of chicken skin; regular consumption of high-fat meats; consumption of added salt; body mass index; waist circumference; total cholesterol, low-density lipoproteins (LDL) and high-density lipoproteins (HDL); triglycerides; and blood glucose [19].
Data processing and analysis
The data were entered independently in duplicate into an electronic form generated with Epi Info 7.1.4 (CDC, Atlanta, USA), which enabled the identification and correction of possible typing errors.
Hardy-Weinberg equilibrium (HWE) was determined with the χ2 test (p > 0.05). This procedure was necessary to certify that the sample complied with the principles of population genetics and as a control measure of the accuracy of the genotype analyses.
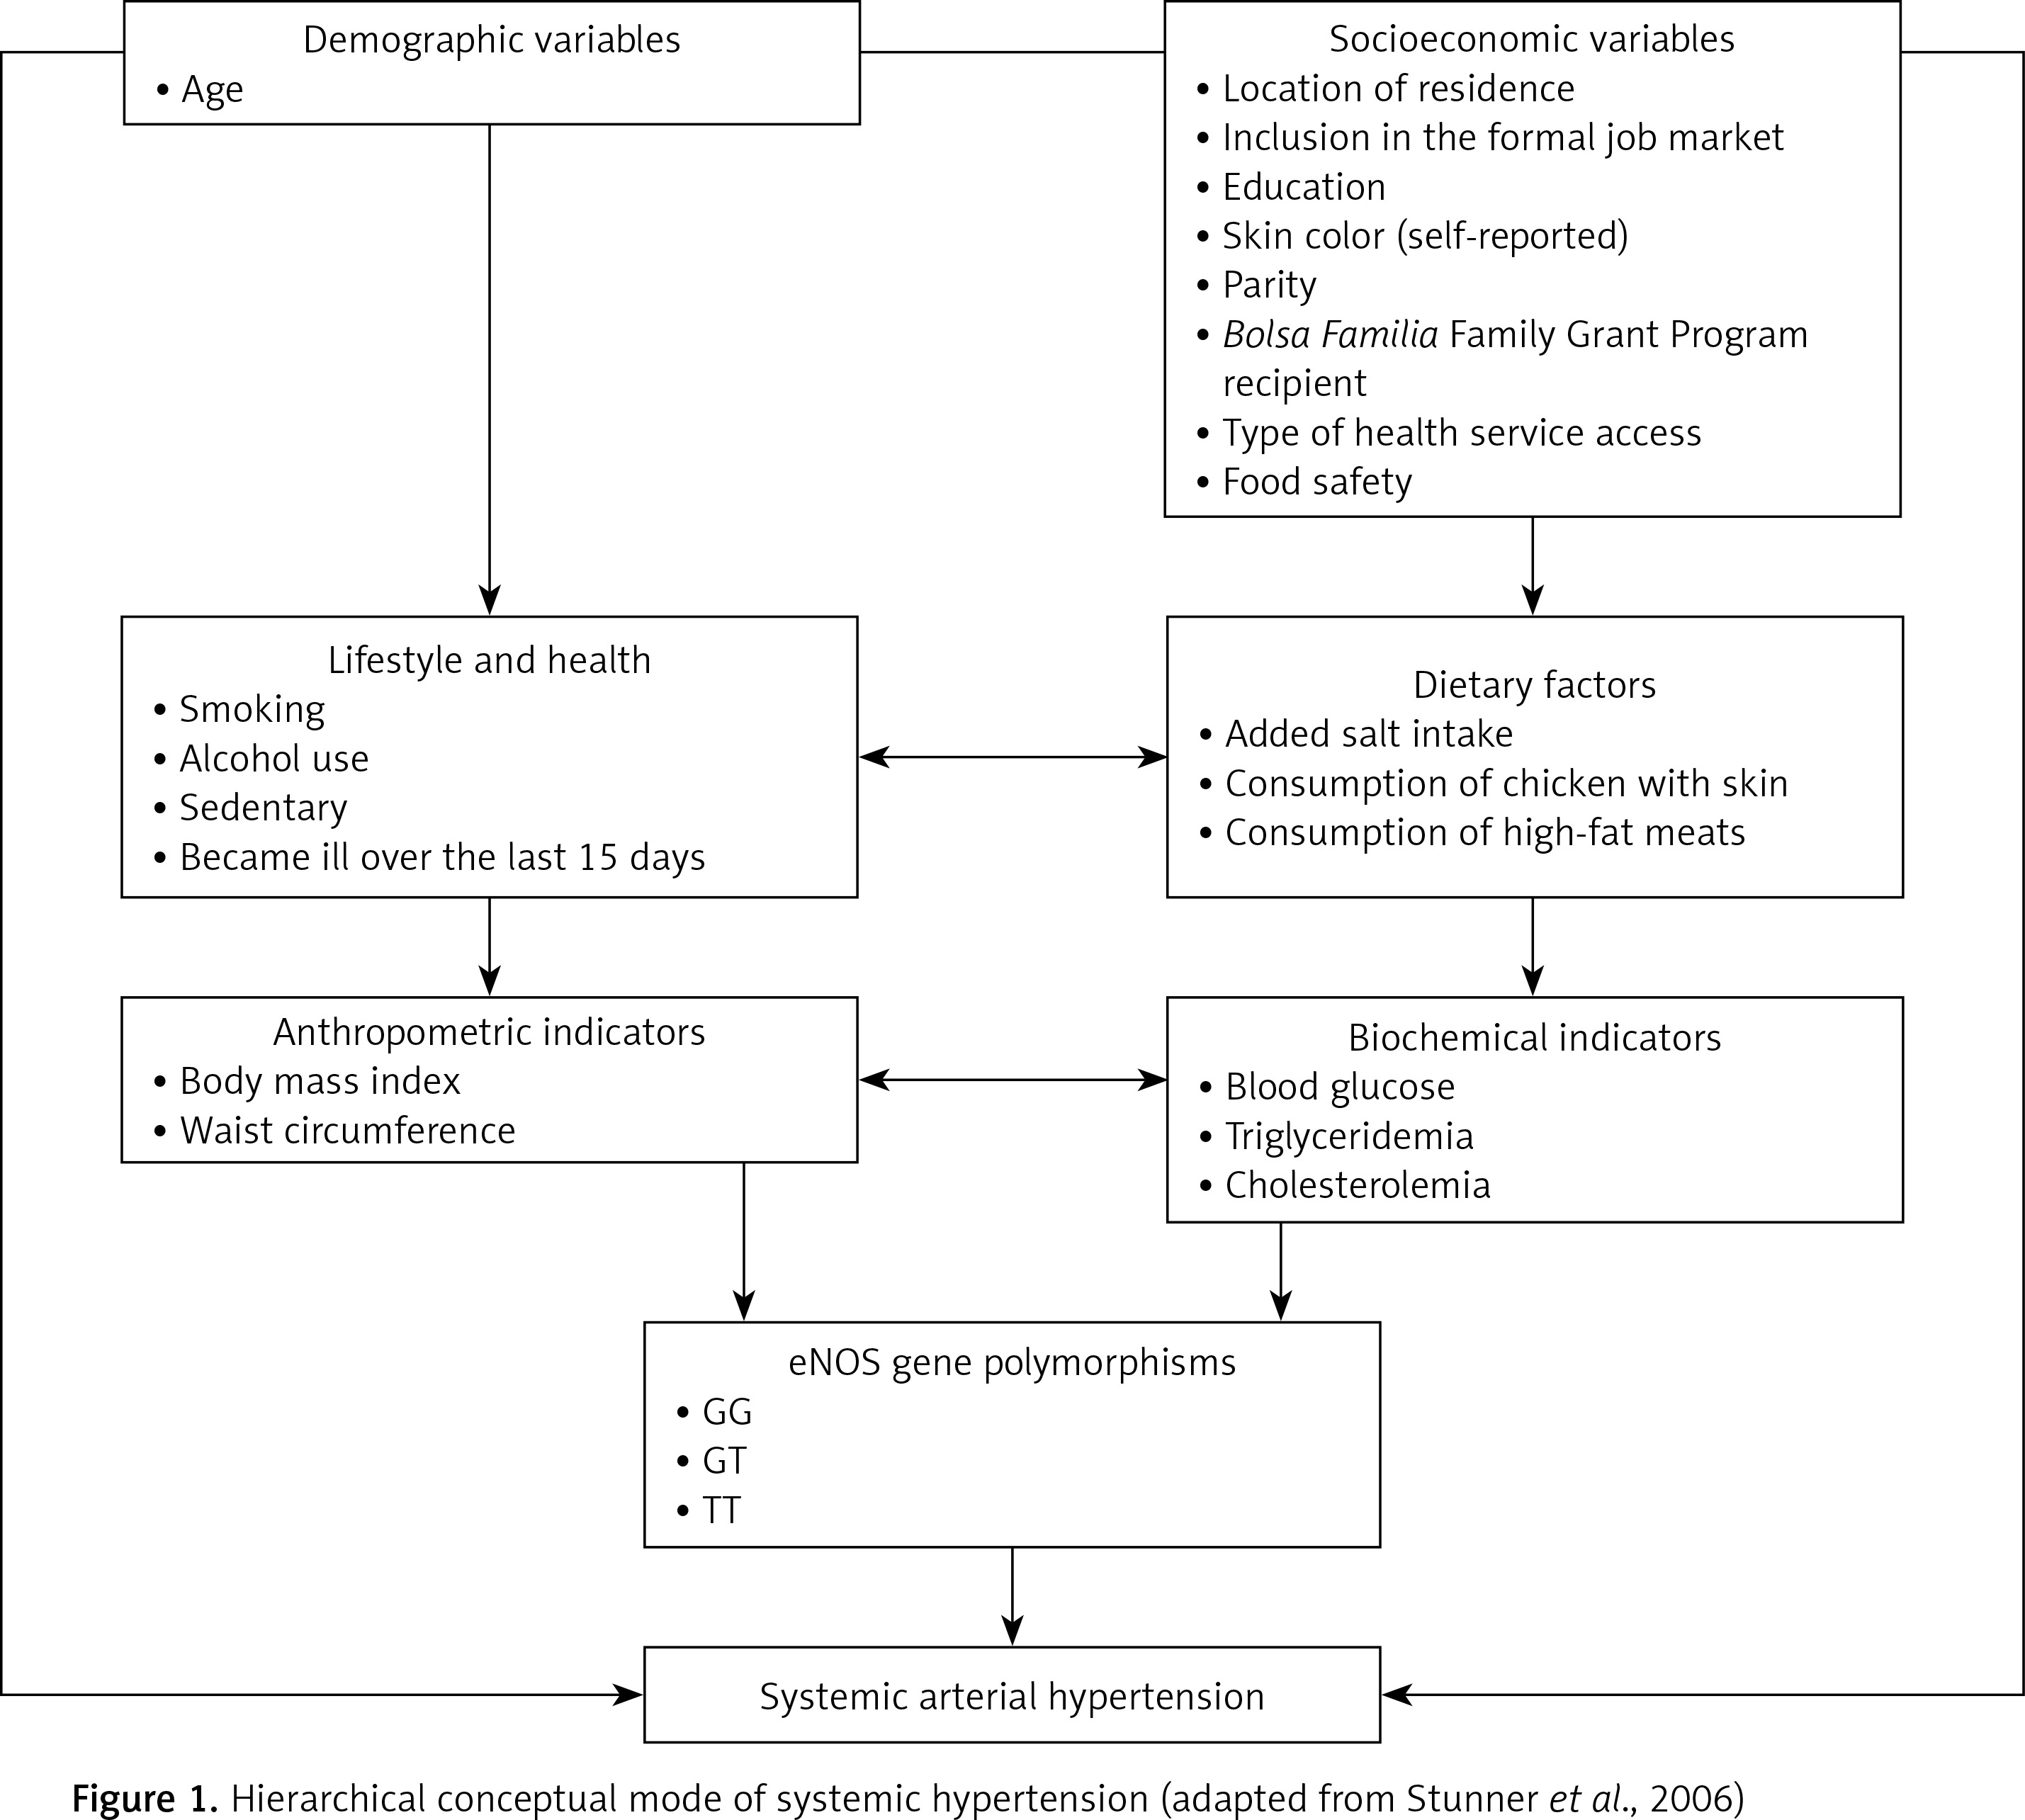
The analysis was performed according to the theoretical model adapted from Sturmer [20] (Figure 1) using two approaches. In the first approach, the dependent variable was hypertension (categorical variable). In the second approach, the dependent variables were SBP and DBP, analyzed as continuous variables. In both situations, the hierarchical analyses were composed of four levels: The first level included the demographic and socioeconomic variables; level 2 included the variables related to lifestyle and dietary factors; level 3 included the anthropometric and biochemical indicators; and level 4 included the associations with the eNOS gene polymorphisms. Level 2 was adjusted by the variables with p < 0.05 at level 1; level 3 was adjusted by the variables with p < 0.05 at levels 1 and 2; and level 4 was adjusted by all variables with p < 0.05 at the previous levels.
To identify the association between hypertension and the GG, GT, and TT genotypes of the eNOS gene G894T polymorphism, the prevalence ratio (PR) and its 95% confidence intervals (CIs) calculated via the Poisson regression were used.
All of the covariates that were associated with hypertension in the basic analysis at a significance level of up to 20% (p < 0.2) were eligible for the hierarchical analysis. Non-significant variables were successively eliminated for each of the four levels of hierarchical analysis (backward stepwise), leaving only those with p < 0.05. From this definition, all of these variables remained in the final adjusted model, even if they lost significance at the levels following their original level to control for possible confounds.
To confirm the association between BP levels and the GG, GT, and TT genotypes, a multiple linear regression analysis was used according to the theoretical model defined for the hierarchical analysis. The procedures for variable inclusion and exclusion were identical to those described above for the Poisson regression analysis. For this approach, the standardized angular coefficients (SACs) were calculated to estimate the increases in blood pressure (mm Hg) according to the different variables introduced in the model. Stata/SE 12.1 for Windows (StataCorp LP, College Station, TX, USA) was used for all statistical analyses. This study was approved by the Research Ethics Committee of the Federal University of Alagoas (Case nº 09093012.0.0000.5013).
Results
A total of 887 women eligible were identified for this study. Of these, 40 (4.5%) were not at home at the time of the interview or refused to participate in the study. In addition, women who did not provide data regarding age (n = 4, 0.9%), anthropometric indices (n = 7, 0.8%), or BP measurements (n = 7; 0.8%) as well as those from whom it was not possible to extract DNA (n = 19; 2.1%) were excluded from the analyses. Therefore, the final sample consisted of 810 women (35.8 ±8.4 years).
The socioeconomic, demographic, lifestyle, anthropometric, biochemical, and genetic variables of the sample are described in Table I. The majority of the sample was of black or brown color/race (75.9%), had up to 8 years of education (58.2%), and had no formal employment (74.5%) at the time of the interview.
Table I
Distribution of hypertension according to socioeconomic, demographic, lifestyle, anthropometric, biochemical, and genetic variables. Women from Alagoas, Brazil (n = 851), 2015
Regarding health conditions, 65.1% of the women reported they were not ill over the last 15 days. Of those who were ill, 91.2% claimed to seek care from public health services. The prevalence of hypertension was 21.1%. Only 8.9% of the women were smokers, but 31.6% reported alcohol consumption. According to BMI, 66.1% were overweight (≥ 30 kg/m2).
The minor allele was T (24.9%), and the genotypic frequencies for the G894T polymorphism were GG = 57.1% (n = 463), GT = 35.7% (n = 289) and TT = 7.2% (n = 58).
The polymorphism distribution conformed to the HWE, with p = 0.16 indicating that the sample population used was in HWE.
Comparing the GG, GT, and TT genotypes, the rates of systemic hypertension were 13.4%, 19.1%, and 32.7%, respectively. Compared with the prevalence of the GG genotype (13.4%), the PRs for the GT and TT genotypes were 1.24 (95% CI: 0.95–1.61; p = 0.11) and 1.76 (95% CI: 1.16–2.67; p<0.01), respectively (Table II).
Table II
Prevalence ratios (PRs) and their respective 95% confidence intervals (95% CI) adjusted in the multivariable Poisson regression according to the hierarchical theoretical model of the determinants of hypertension. Women from Alagoas, Brazil, 2015
Lipid and glycemic disorders were not significant risk factors for systemic hypertension. After an adjusted analysis, the factors that were significantly associated with hypertension were age ≥ 30 years old, residing in a rural area, education ≤ 8 years, having three or more children, being overweight (BMI ≥ 25 kg/m2), and having a large waist circumference. Compared with the GG genotype, the adjusted PRs for the GT and TT genotype were 1.24 (95% CI: 0.95–1.61; p = 0.11) and 1.76 (95% CI: 1.16–2.67; p < 0.01), respectively.
GT was not significantly different between hypertensive and normotensive groups, whereas the TT genotype was significantly higher in those with hypertension. The multiple regression analysis showed that both women with GT genotype and those with TT genotype had BP levels significantly higher than those observed in women with the GG genotype, even after adjusting for confounds.
Specifically, compared with the GG genotype, women who had the GT and TT risk genotypes had increases in SBP of 2.72 mm Hg (p = 0.02) and 8.32 mm Hg (p < 0.01), respectively. In the case of DBP, the increase was 1.79 mm Hg (p = 0.03) for the GT genotype and 4.69 mm Hg (p < 0.01) for the TT genotype (Table III).
Table III
Standardized angular coefficients (SACs) adjusted in the multivariate linear regression related to systolic and diastolic blood pressure levels according to the hierarchical theoretical model of the determinants. Women from Alagoas, Brazil (n = 810), 2015
Discussion
The present study provides evidence that the polymorphism G894T of the eNOS gene is associated with higher BP levels and, consequently, with a higher prevalence of hypertension.
Since the first literature reports, NO has been considered of fundamental importance in the regulatory process of vascular homeostasis, with its levels being regulated by the eNOS gene. Several polymorphisms have been studied in an attempt to understand the genetic susceptibility to cardiovascular diseases [21].
A greater number of homozygous individuals (GG) were present in our study (57.2%). In agreement with our results, a study of an Egyptian population found a higher frequency of the GG genotype (70%) compared with GT (22.9%) and TT (7.1%) polymorphisms. Similar results were found in African populations [22–24].
Studies of Asian populations have also shown a predominance of the GG genotype; moreover, few or no people with the TT genotype were observed in Korea (n = 411; GG: 97.6%, GT: 19.5%, and TT: 0.9%) [25], Japan (n = 513; GG: 84.4%, GT: 17.4%, and TT: 0.0%) [25], and India (n = 105; GG: 74.3%, GT: 25.7%, and TT 0%) [26] .
Our study found an association between systemic hypertension and risk factors such as age, location of residence, overweight, and waist circumference. Several studies have shown that, in addition to hereditary factors, hypertension is influenced by several risk factors such as age, gender, ethnicity, overweight/obesity, alcohol consumption, sedentary lifestyle, and socioeconomic factors [14, 27, 28].
The prevalence of hypertension in women in Alagoas (21.1%) was similar to the estimated value for the Northeast region (19.4%) and Brazil in general (24.2%) [29].
In the current sample, the presence of the TT genotype was associated with a greater predisposition toward systemic hypertension. Evidently, these women also have higher BP levels than those with the GG genotype. For those with the GT genotype, the differences between the rates of hypertension were not significant. However, as with those who carried the TT genotype, they had higher BP levels than the reference genotype. Therefore, these data show that the presence of the T allele is an important risk factor for hypertension.
A recent meta-analysis of 63,258 participants showed that those with the T allele for the G894T polymorphism of the eNOS gene showed a significant risk for systemic hypertension compared with individuals with the G allele (G vs. T, p < 0.00001, OR = 0.82, 95% CI: 0.76–0.89) [30].
In another meta-analysis of 45,287 individuals, the T allele of the G894T polymorphism was positively associated with hypertension (OR = 1.20; p = 0.015) [31]. In addition to hypertension, reports have linked the G894T polymorphism of the eNOS gene to higher rates of diseases such as ventricular hypertrophy, coronary artery disease, and deep vein thrombosis [32, 33].
As previously mentioned, the linear regression showed that the TT and GT genotypes were associated with significantly higher SBP and DBP levels, even after controlling for several confounds.
In a study of Caucasian individuals from the Iberian peninsula, Goni et al. found a significantly higher DBP of 1.99 mm Hg in people with the GT or TT genotype compared with those with the GG genotype [12].
The adjusted analysis revealed an interaction between BMI and the G894T polymorphism with regard to the modulation of SBP and DBP levels. This observation corroborates the results found by Abdel-Aziz et al. [34], who described the association between obesity and the TT genotype of the G894T polymorphism with regard to increasing the risk of developing coronary artery disease among the Egyptian population.
Different studies revealed that the presence of thymine (T) instead of guanine (G) at nucleotide 894 of the gene responsible for the production of eNOS alters one or more of the functional properties of the enzyme that decreases its catalytic activity and therefore compromises the production of NO [35, 36].
Kayhan et al. studied the effects of eNOS associated with hypertension among Turkish patients and suggested that the G894T polymorphism of the eNOS gene increases the risk of hypertension when associated with high serum levels of total cholesterol [37]. Increased serum cholesterol levels in the circulatory system lead to increased lipid oxidation, resulting in elevated BP and increased amounts of reactive oxygen species (ROS), which reduced the expression of eNOS and decreased the production of NO [38]. Furthermore, oxidative stress is a common process associated with obesity and has been associated with the eNOS gene. An animal model study suggested that a reduction in NO production leads to an increase in ROS, contributing to hypertension in obese rats [39].
The present study sampled an ethnically heterogeneous population that included individuals with European and African ancestry as well as indigenous peoples; therefore, this sample contained people with different genetic backgrounds. As such, these results should be generalized to other populations with caution (i.e., by defining to what extent the referred population is similar to the profile of the population of the present study).
One limitation of the present study was the non-inclusion of men in the sample. This occurred because this work was part of a larger project called II Diagnosis of maternal and child health in the state of Alagoas, in which the focus was on children, adolescents and women of childbearing age. Some results obtained from this project are available elsewhere [40–46]. Therefore, considering the overall population of the state, the men and the elderly of both sexes were left out. For this study, as already explained, women between the ages of 19 and 49 were eligible. Thus, given the existing differences in the occurrence of hypertension according to gender, it is suggested to carry out additional studies that include male subjects.
In conclusion, the results indicate that the TT genotype of the eNOS gene G894T polymorphism is significantly associated with a higher prevalence of hypertension and is an important risk factor for this disease, especially when it is associated with older age groups and excess body weight.
Considering that the mechanism of action that might cause women with the GT or TT genotype to present with higher BP levels involves less metabolic production of NO, the current findings suggest that this polymorphism is directly related to the regulation of BP and might be an important marker in the diagnosis of systemic hypertension.