Introduction
Although kidney stones are a common urological disease, their aetiology is complex and still not fully elucidated. Interestingly, in recent years it was found that nanobacteria are closely related to kidney stones [1]. Acting as nucleation sites, these bacteria are thought to further promote the development of calcification [2], which can damage renal tubular epithelial cells and reduce the elasticity of the kidney tissue. The adhesion of tubular epithelial cells to the crystals induces the formation of nuclei, thereby inducing the formation of kidney stones. Nanobacteria have a unique biomineralization ability and aggregate growth characteristics [3]. Nanobacteria attract each other to aggregate and grow, and their mineralization phenotype forms a unique protective shell, which can withstand extremely harsh environments such as low and high temperatures. The bacteria have specific and powerful defence capabilities against many antibiotics [4], but tetracycline can penetrate the mineralized shell and thus inhibit the action of nanobacteria [5].
More than 80% of kidney stones are composed of calcium oxalate [6], while the most important cation in kidney stones is calcium [7]. The increase of urinary calcium consequently plays a key role in the occurrence of kidney stones [8], and 30% of patients with kidney stones have high urinary calcium [9], the concentration of which affects the formation of calcium phosphate and calcium oxalate [10]. High urinary calcium can therefore be used as an indicator of the risk of kidney stones [11].
Urinary calcium levels are directly dependent on the balance of glomerular filtration and reabsorption of calcium ions [12]. Calcium ion concentration gradients are generated by water reabsorption and Na+/K+-ATPases, and this process is mainly dependent on the presence of tight junctions between the proximal renal tubules and the medullary cells. One study found that calcium-sensitive receptor (CaSR) can regulate the reabsorption of calcium ions by renal tubules by regulating the expression of tight junction protein-14 (Claudin-14) [13], thus affecting urinary calcium excretion. When this process is affected, urinary calcium reabsorption is blocked, resulting in an increased urinary calcium concentration, which may be one of the main risk factors for the formation of kidney stones [14].
In view of the current research on the role of nanobacteria in the formation of kidney stones, we speculated that nanobacteria may induce a series of pathological changes in the kidney during the formation of stones, and they have an effect on the regulation of CaSR and Claudin-14, which are important protein regulators of calcium homeostasis. However, specific dynamic research is needed.
Material and methods
Experimental animals
A total of 90 six-week-old, male, specific-pathogen-free (SPF) Wistar rats weighing 200 ±20 g were purchased from Xinjiang Medical University (certificate number SCXK [new] 2013-0001; new medical verb SYXK [new] 2010-0003, welfare ethics Examination certificate number: [2016] Yuan Lunzheng Shizizi [001] [NO. A2016-001]). After one week of adaptation, the rats were randomly divided into 3 groups according to the random number table method: (1) Control group (NC group): intravenous saline injection of 1.2 ml + 2 ml saline administered intragastrically once a day for 7 consecutive days. (2) Nanobacteria-induced stone (NBS group): tail vein injection of 1.2 ml NB suspension + 2 mL saline gavage, once a day for 7 days. (3) Interference group (NBT group): Intravenous injection of 1.2 ml NB suspension + 2 ml intragastric tetracycline solution (60 mg/kg), once a day for 7 consecutive days.
Experimental instruments and reagents
The following materials from the listed vendors were used: DMEM medium (GIBCO, USA), foetal bovine serum (GIBCO, USA), normal saline (Sichuan Kelun Pharmaceutical Co., Ltd., China), chloral hydrate (Beijing Chemical Reagent Company, China), Protein marker (DUPONT Company, USA), 10% neutral Formalin (Gynecology Department, Shihezi University School of Medicine), CaSR Antibody (Abcam, USA), Claudin-14 antibody (Abcam USA), Tetracycline (Shanxi Yunpeng Pharmaceutical Co., Ltd., China), DAB chromogenic kit (Nakasu Jinqiao Biotechnology Co., Ltd., China), upstream and downstream CaSR primers (Abcam USA), Claudin-14 upstream and downstream primers (Abcam, USA), protein quantification kit (BCA) (Pulley, China), and Trizol extraction kit (Abcam USA).
The instruments used for the experiment included an optical microscope (Olympus, Japan), BX40 image acquisition system (Olympus, Japan), digital camera system (OLYMPUS DP70) (Olympus, Japan), frozen slicer (Leica, Germany), pathohistological tissue de-staining station (Changzhou Zhongwei Electronic Instrument Factory), automatic biochemical analyzer (Modual DPP) (Royce, Germany), electron microscope (JEOL-1230 Electronics) (JEOL, Japan), microplate reader (Thermo Fisher Scientific, USA), PCR thermocycler (BioRad, USA), and a stone component analyzer (Blue Mod Scientific Instrument Co., Ltd.)
Source of nanobacteria
Selected patients with confirmed kidney stones without urinary tract infections or reported drug use had mid-term morning urine collected before surgery, from which nanobacteria were cultured and identified as reported earlier [15]. After successful cultivation, the nanobacteria were collected and made into a nanobacterial suspension having an absorbance value of 1.00 at a wavelength of 650 nm, which was used for the experiments.
Experimental methods
Specimen collection
The modelling period lasted for 10 weeks. Three rats were randomly selected from each group every week. The urine of each group was collected in the metabolic cage, and then 10% chloral hydrate was injected intraperitoneally. After the anaesthesia was effective, the enterocoely was opened aseptically. In the abdominal cavity, 4 ml of blood from the vena cava was taken for examination, and then the rats were sacrificed. The bilateral kidneys were removed, one side of the kidney was frozen, and the other side was fixed with a neutral formaldehyde solution.
Gross kidney specimens and stone formation
The whole kidney and the profile of the kidney were visually inspected and assessed, including assessing the quality of both kidneys by correlative research , using the kidney to calculate the renal body ratio, observing the colour, structure, and surface of the kidney with or without localized bulges, dissecting the kidney, observing the presence or absence of stones, and observing the presence or absence of crystals in the kidney using a dissecting microscope.
Biochemical analysis of the blood and urine samples of the Wistar rats
Rat blood and urine samples were collected and examined using an automatic biochemical analyser.
Analysis of stone composition
Stone composition analysis was performed using an infrared spectrum automatic analyser (stone composition analyser) according to the manufacturer’s instructions.
Histopathological observation
The kidney specimens were fixed, embedded in paraffin, sectioned into 5-μm slices, and stained with haematoxylin at 56°C for 15 min. The renal tubules and surrounding tissues, and the location and amount of crystal formation were observed under a light microscope and graded. The number of animals positive for crystals in each group was counted.
Electron scanning microscopic observation of kidneys
The kidney specimens were fixed, rinsed, dehydrated, embedded, and sliced into 30-nm sections using an ultramicrotome, and then electronically sputtered with staining. Finally, the prepared specimens were observed using scanning electron microscopy.
Detection of CaSR and Clanudin-14 protein expression in rat kidney tissues by immunohistochemistry
Another part of the kidneys from the test animals and controls that succeeded in the pathological identification model were used for SP immunohistochemistry. The steps were as follows: (1) The kidney tissue to be tested was embedded in paraffin, sliced into 5-μm sections, and then dewaxed using xylene. (2) The endogenous peroxidases were blocked by incubating for 10 min in 3% hydrogen peroxide solution at 25°C, followed by incubation for 10 min in 0.01 M Na+-citrate buffer pH = 6 at 25°C to recover the antigens, and blocking with rat serum for 15 min at 25°C. (3) A CaSR antibody at a concentration of 1 : 150 and a Clanudin-14 antibody at a concentration of 1 : 200 were separately added, and the mixture was incubated overnight at a constant temperature of 4°C. (4) After washing with TBST 3 times, the secondary antibody was added dropwise, and the colour was adjusted using a DAB microscope and then stained with haematoxylin. (5) Dehydration was performed with a graded series of alcohol solutions (75, 85, 95, and 100%) and xylene at 37°C for 3 min each time, followed by sealing with neutral resins. (6) Immunohistochemical staining of CaSR and Clanudin-14 was observed under an optical microscope.
Detection of CaSR and Claudin-14 mRNA expression in kidney tissue by qRT-PCR
The total RNA of kidney tissue was extracted using the Trizol kit, cDNA was synthesized using the kit, and the expression changes of CaSR and Claudin-14 protein were detected by real-time PCR using the primers.The PCR temperature program was 95°C.
Western-blot analysis of the expression of CaSR and Claudin-14
The total protein from the kidney tissues was extracted using the kit, and the concentration of the extracted protein samples was measured by the BCA method. Flowing the gradient dilution of BSA standard product, making the gel, loading the sample, by electrophoresis method, transferring membrane, immunoreaction, chemiluminescence and detection, and gel image analysis were performed.
Statistical analysis
SPSS 22.0 software (IBM Cop., USA) was used for statistical analysis. The measurement data were expressed using mean ± standard deviation. The data of each group of rats were analysed using variance. The data of 2 groups were compared using the χ2 test. The crystal formation of each group was compared using the rank sum test. The Kruskal-Wallis test was used with α = 0.05.
Results
Establishment of a kidney stone model
Observation of the rats’ growth status
During the modelling period, there were no fatalities in any of the 3 groups of rats. In the first and the second weeks of the modelling period, all the rats in the 3 groups were eating normally, and there was no excitement or irritability. At the beginning of the third week, the rats in the nanobacteria group showed excitement and good movement, and some of them showed an increase of body mass with the extension of the modelling time. The rats in the interference group also had abnormalities such as excitement and hyperactivity, but the irritability was not obvious. There were no abnormalities in the control rats.
Gross specimen and renal body ratio
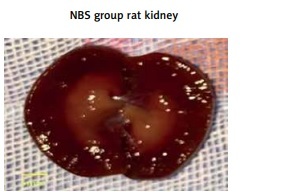
Between the first and third week of modelling, the kidneys of the rats were not swollen and the morphology was normal. At the fourth week, the kidneys of the rats in the nanobacterial group increased slightly, the colour deepened, and the kidneys were cut longitudinally. The renal cortex was dark red, the medulla was orange-yellow, and the structure of the cortex was clear. With the prolongation of modelling time, the kidney volume gradually increased, the colour of the kidneys gradually deepened, the structure of the parenchyma gradually deteriorated, and these changes were also observed in the interference group. The tissue in the interference group was only slightly lighter than in the nanobacteria group, and the kidney morphology did not change significantly during the modelling period. In the nanobacteria group, a small number of pale-yellow particles precipitated in the cortex at the sixth week, the precipitate was distributed in a fan shape with the renal pelvis at the centre, and there was a sand-like sensation (Figure 1 A).
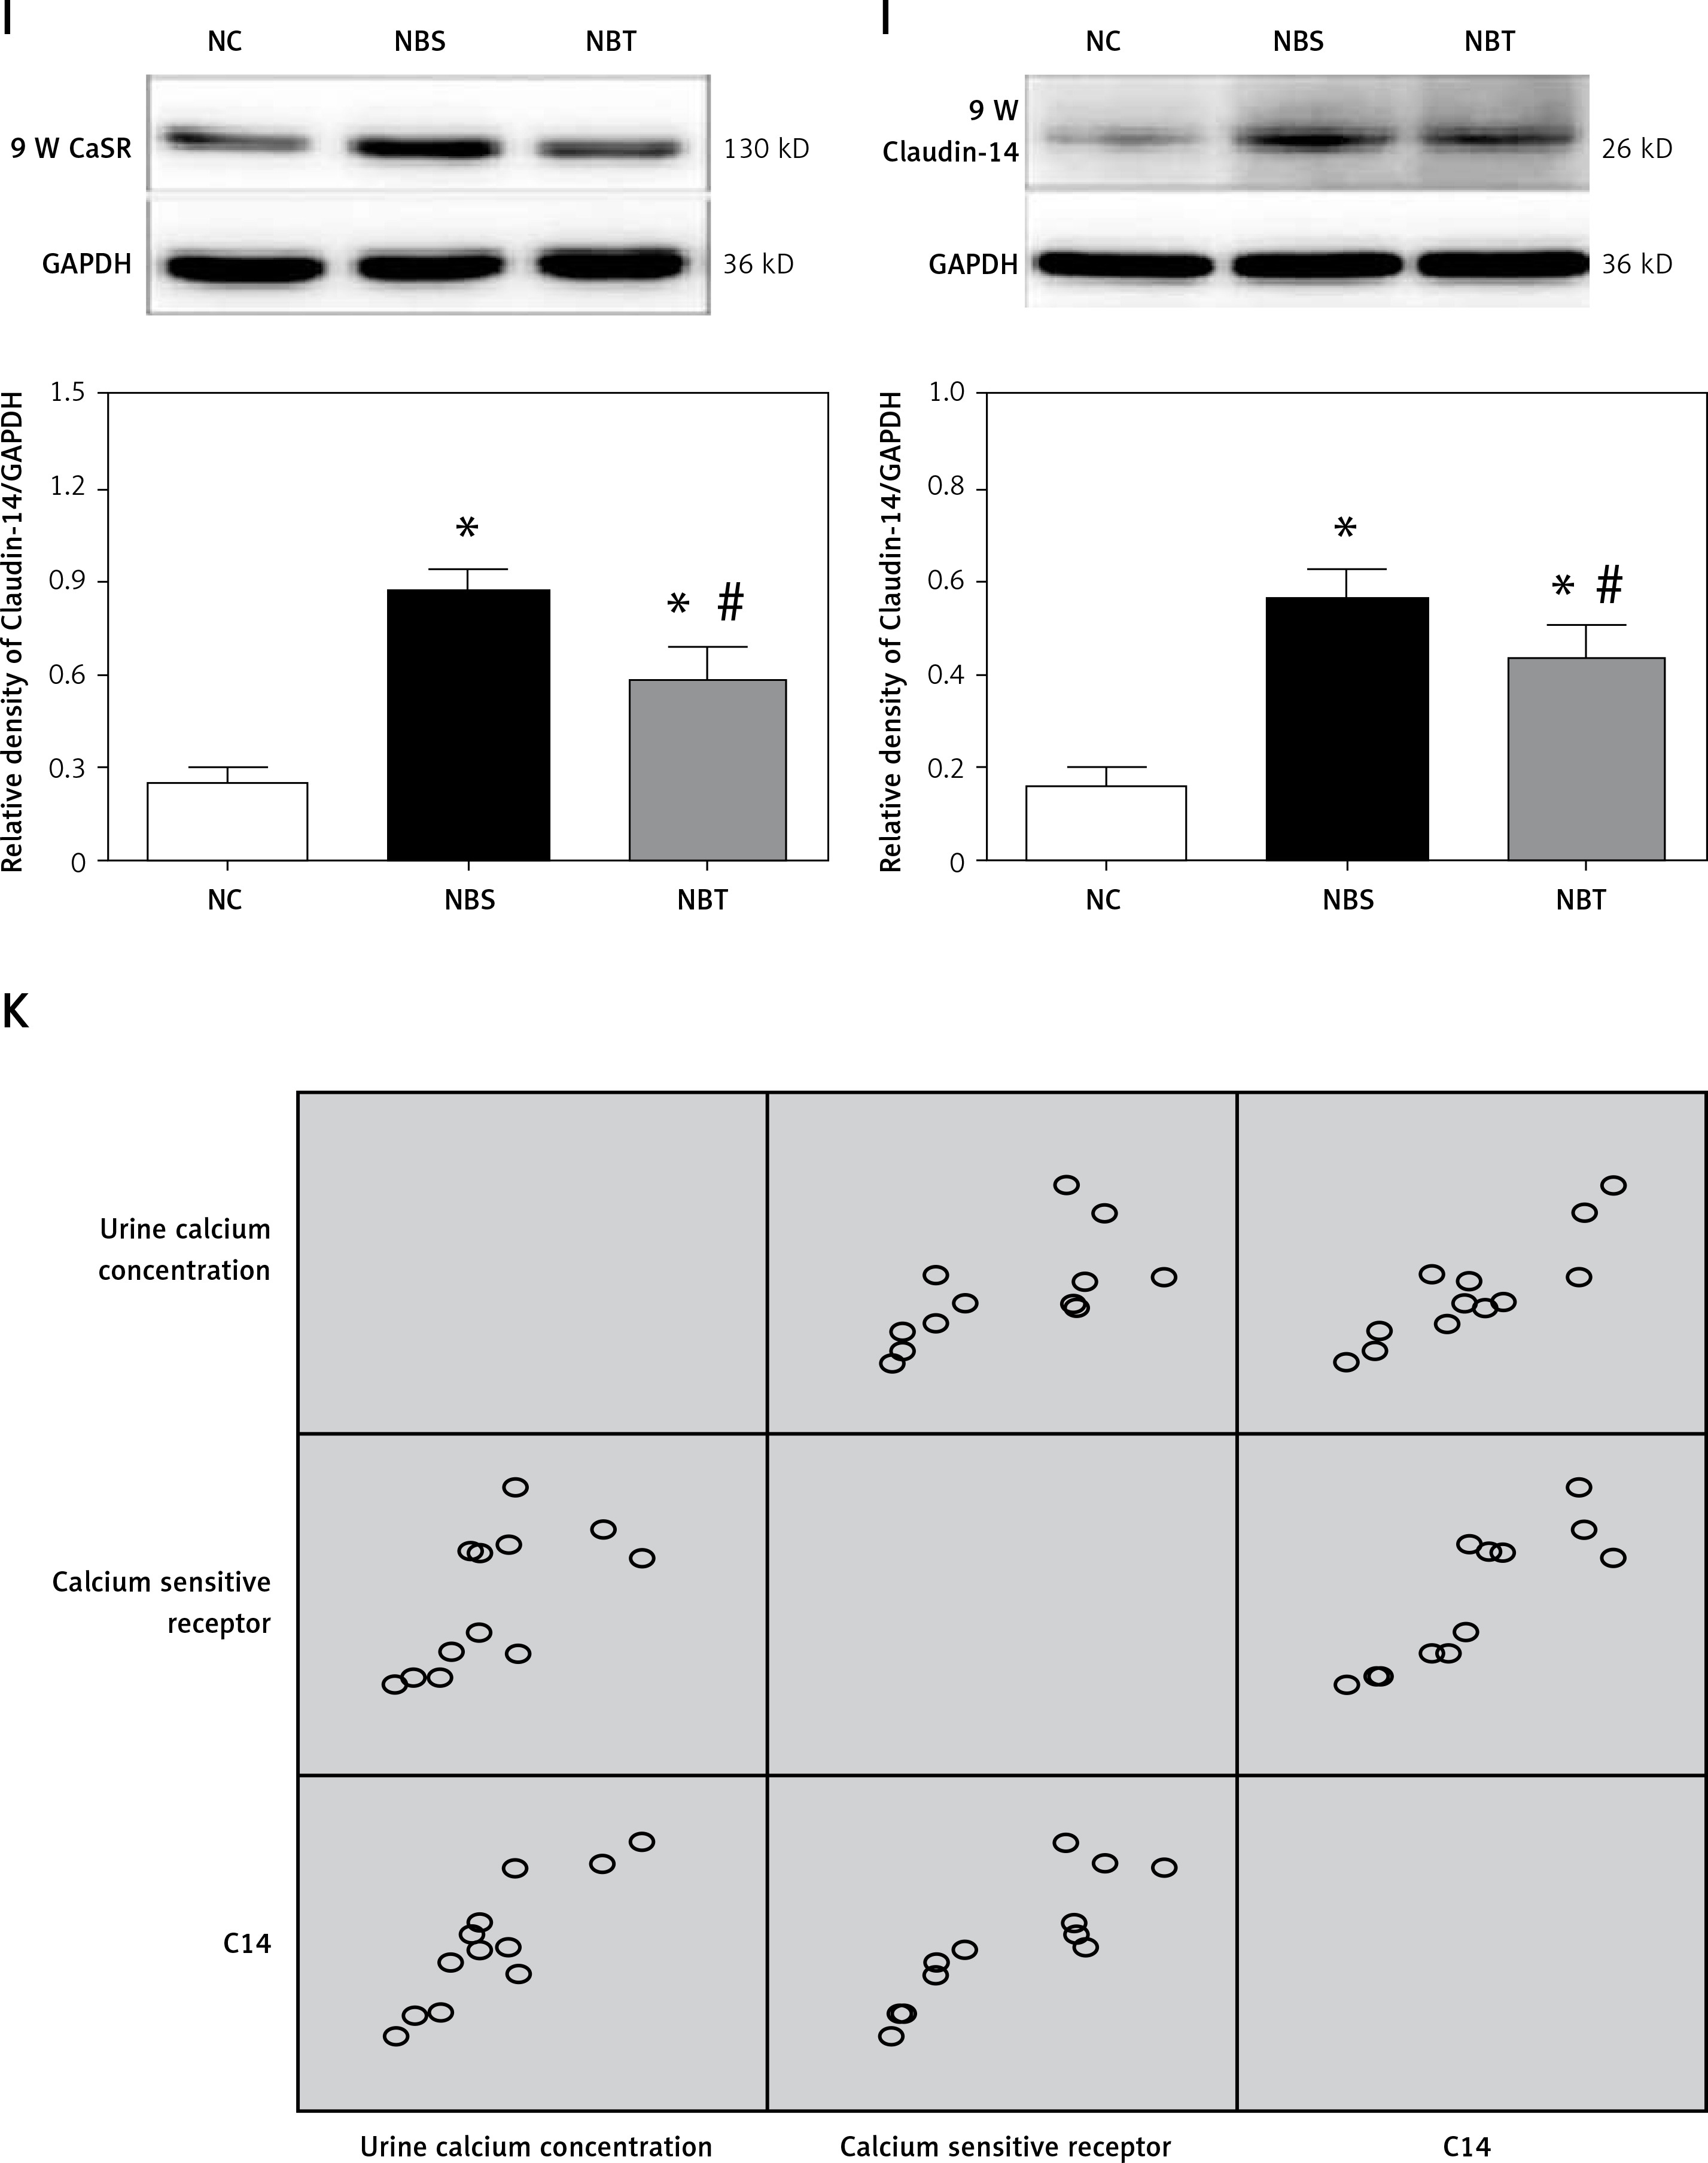
A – Three groups of rat kidney profiles. B – Comparison of blood biochemistry in NBS, NBT and NC groups C – comparison of urine biochemistry between NB, NBT and NC rats. D – group of kidney paraffin sections (H + E, 200×). E – Electron microscopy of each group (8000×) F – Positive expression of CaSR in kidney tissues of Wistar male rats (immunohistochemistry 200×). G – Positive expression of Claudin-14 in kidney tissues of Wistar male rats (immunohistochemistry 200×). H – Comparison of CaSR and Claudin-14 mRNA expression in each group at different time points (n = 3) I – Groups of kidney tissue CaSR Western-blotting results. J – Groups of kidney tissue Claudin-14 Western-blotting results. K – Correlation between CaSR and Claudin-14 protein expression and 24 h urinary calcium excretion
*There is a difference between in NC group and the other groups (p < 0.05), and # is the difference between the NBS and NBT groups (p < 0.05).
A – Three groups of rat kidney profiles. B – Comparison of blood biochemistry in NBS, NBT and NC groups
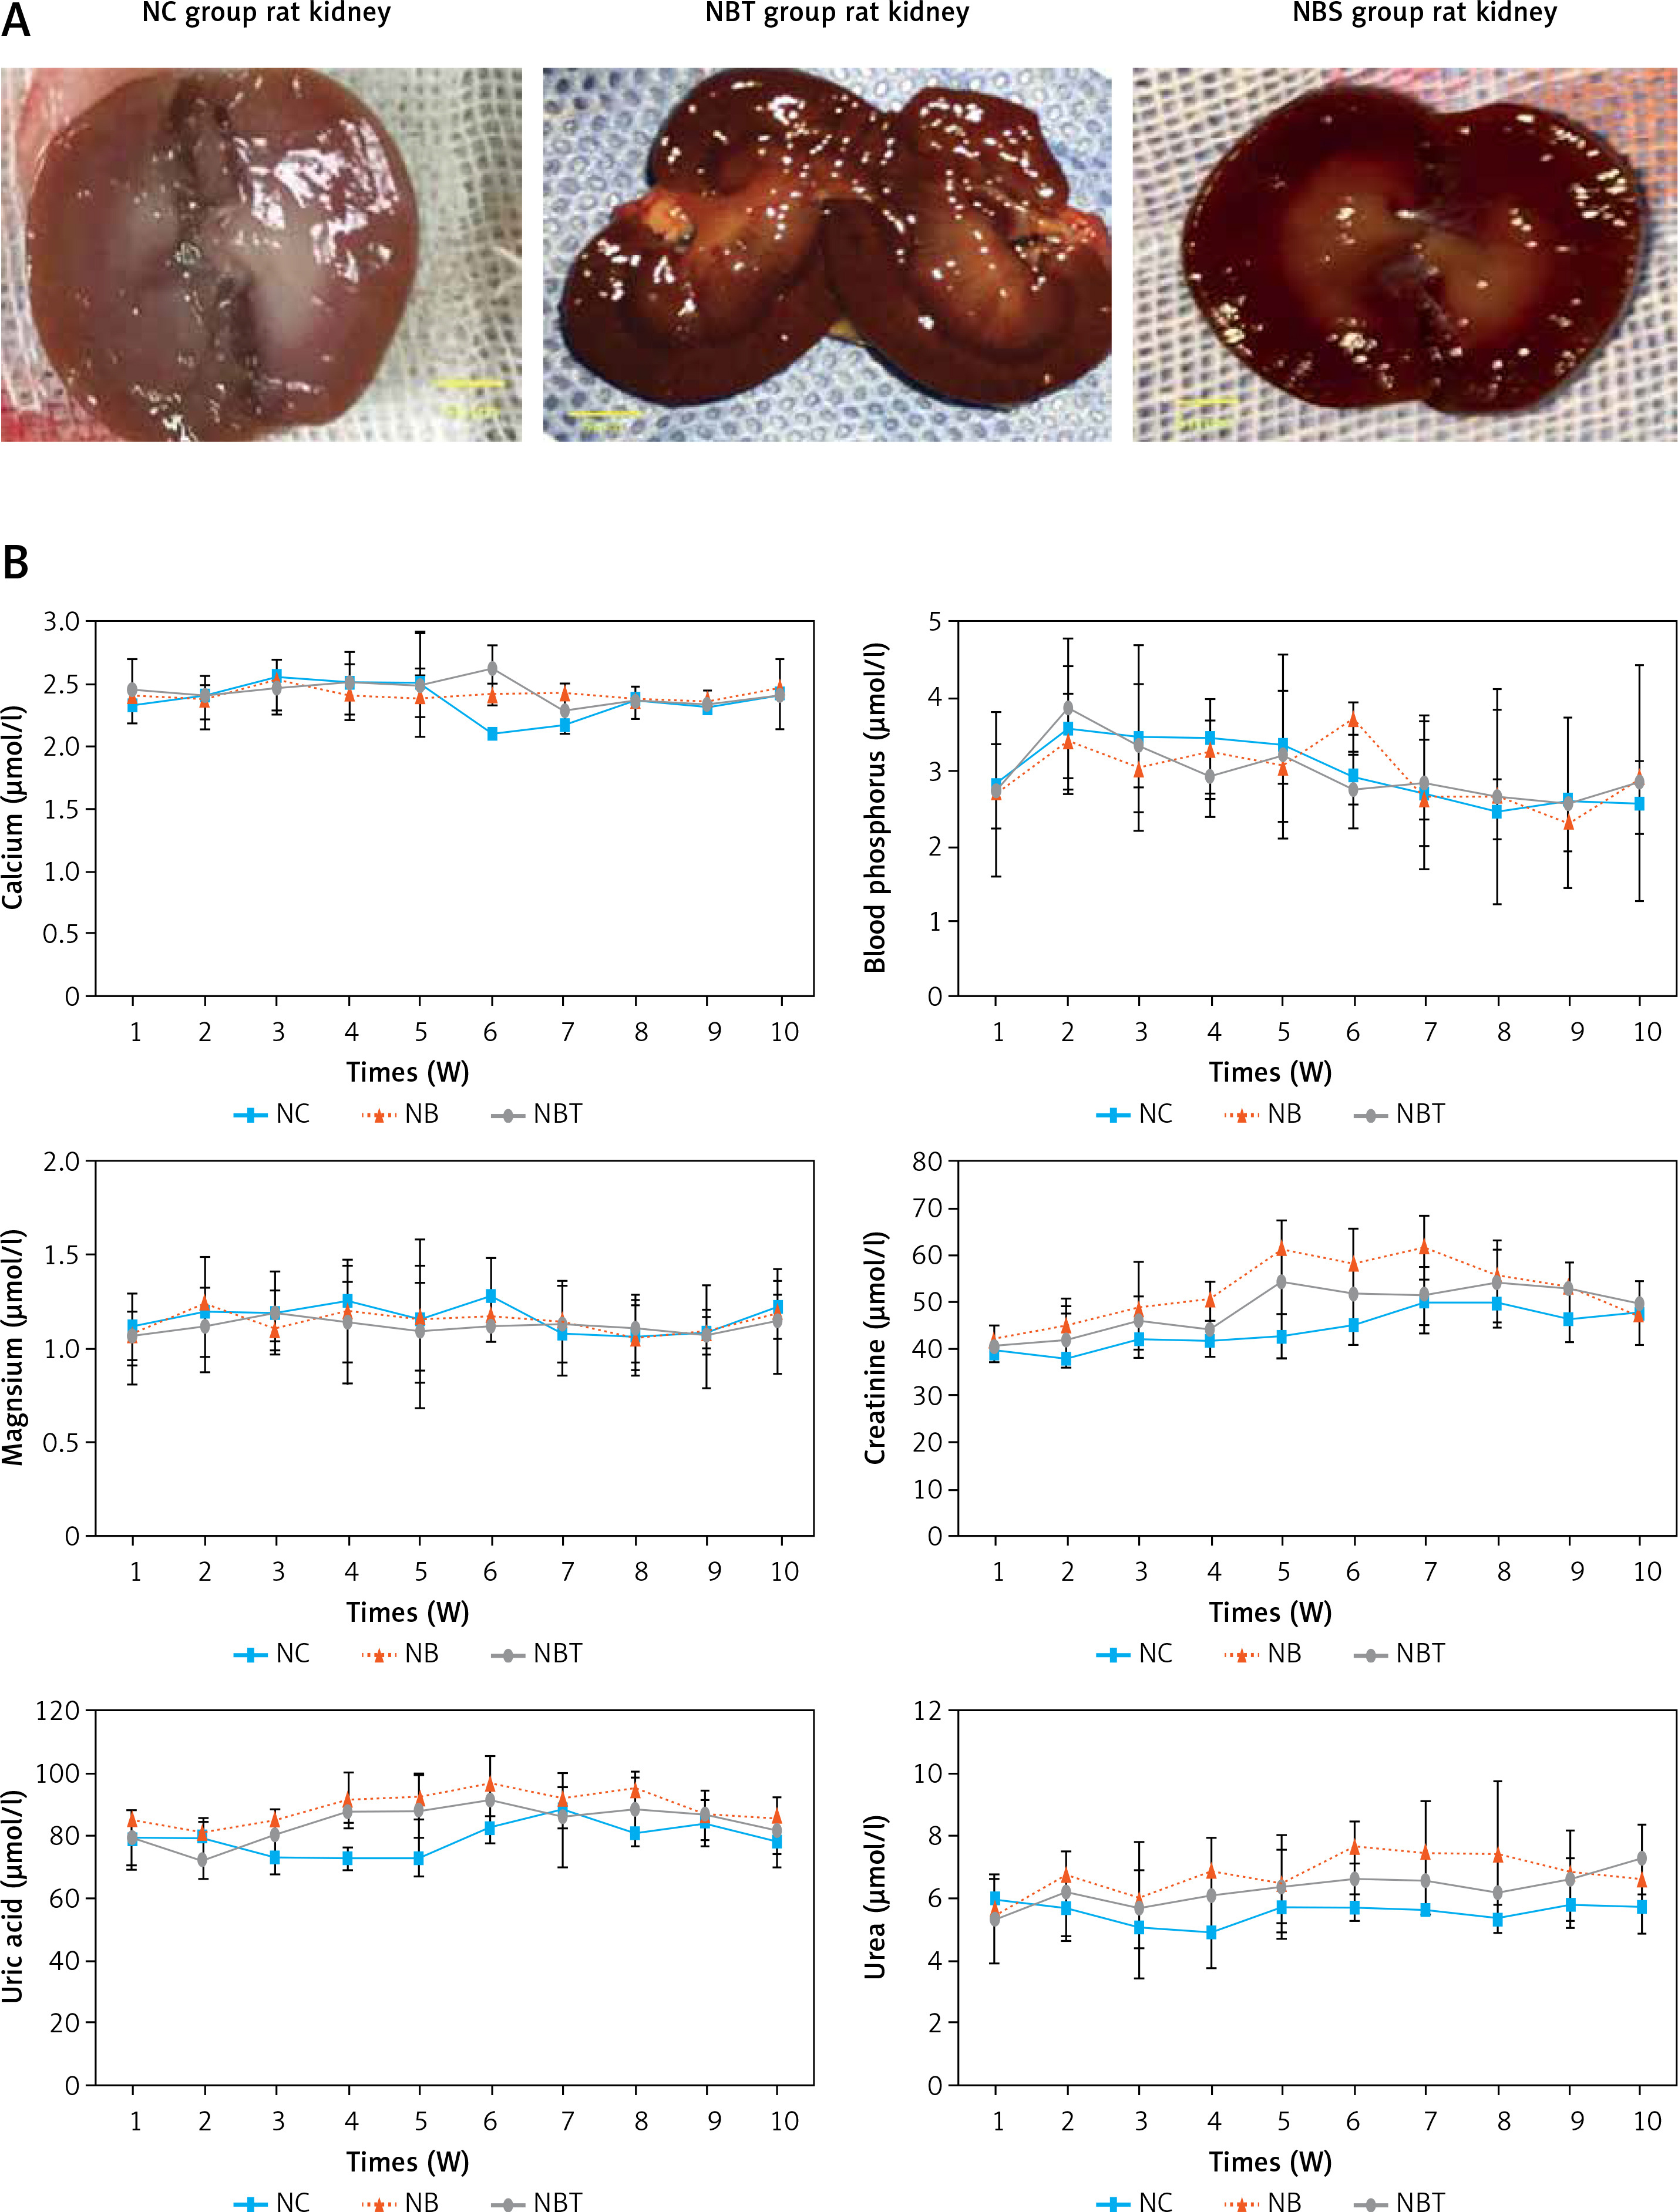
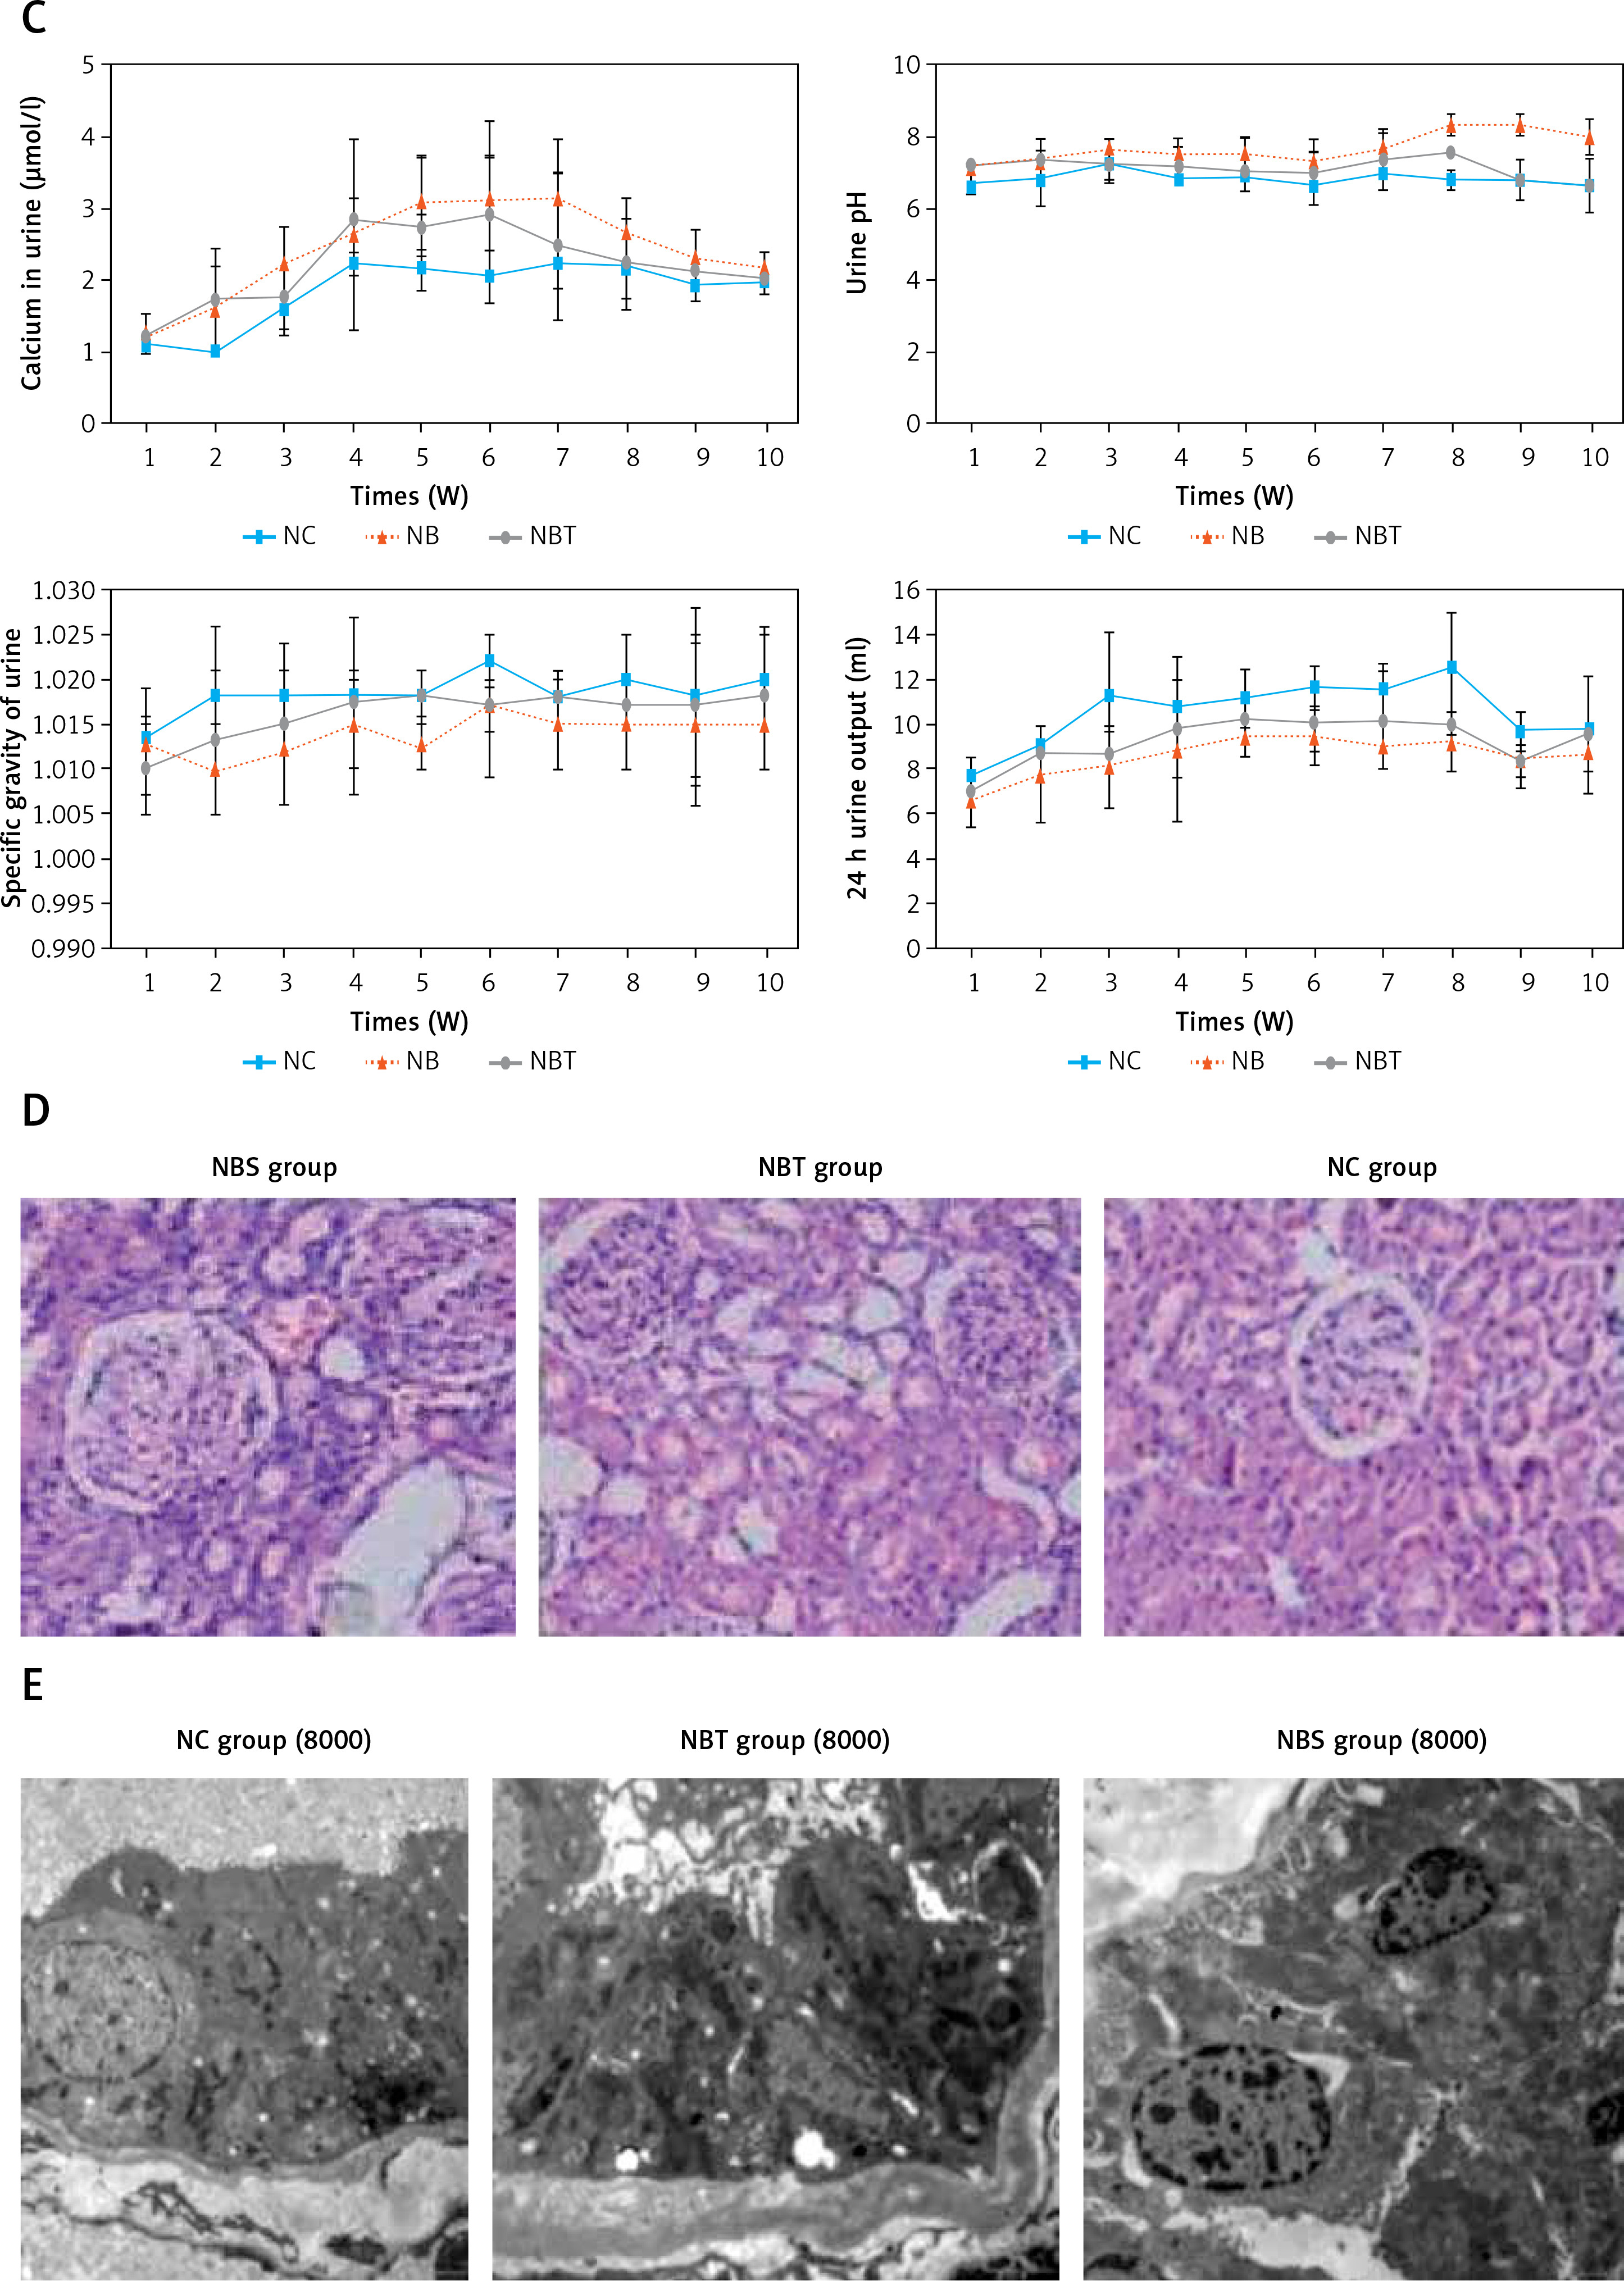
C – comparison of urine biochemistry between NB, NBT and NC rats. D – group of kidney paraffin sections (H + E, 200×). E – Electron microscopy of each group (8000×)
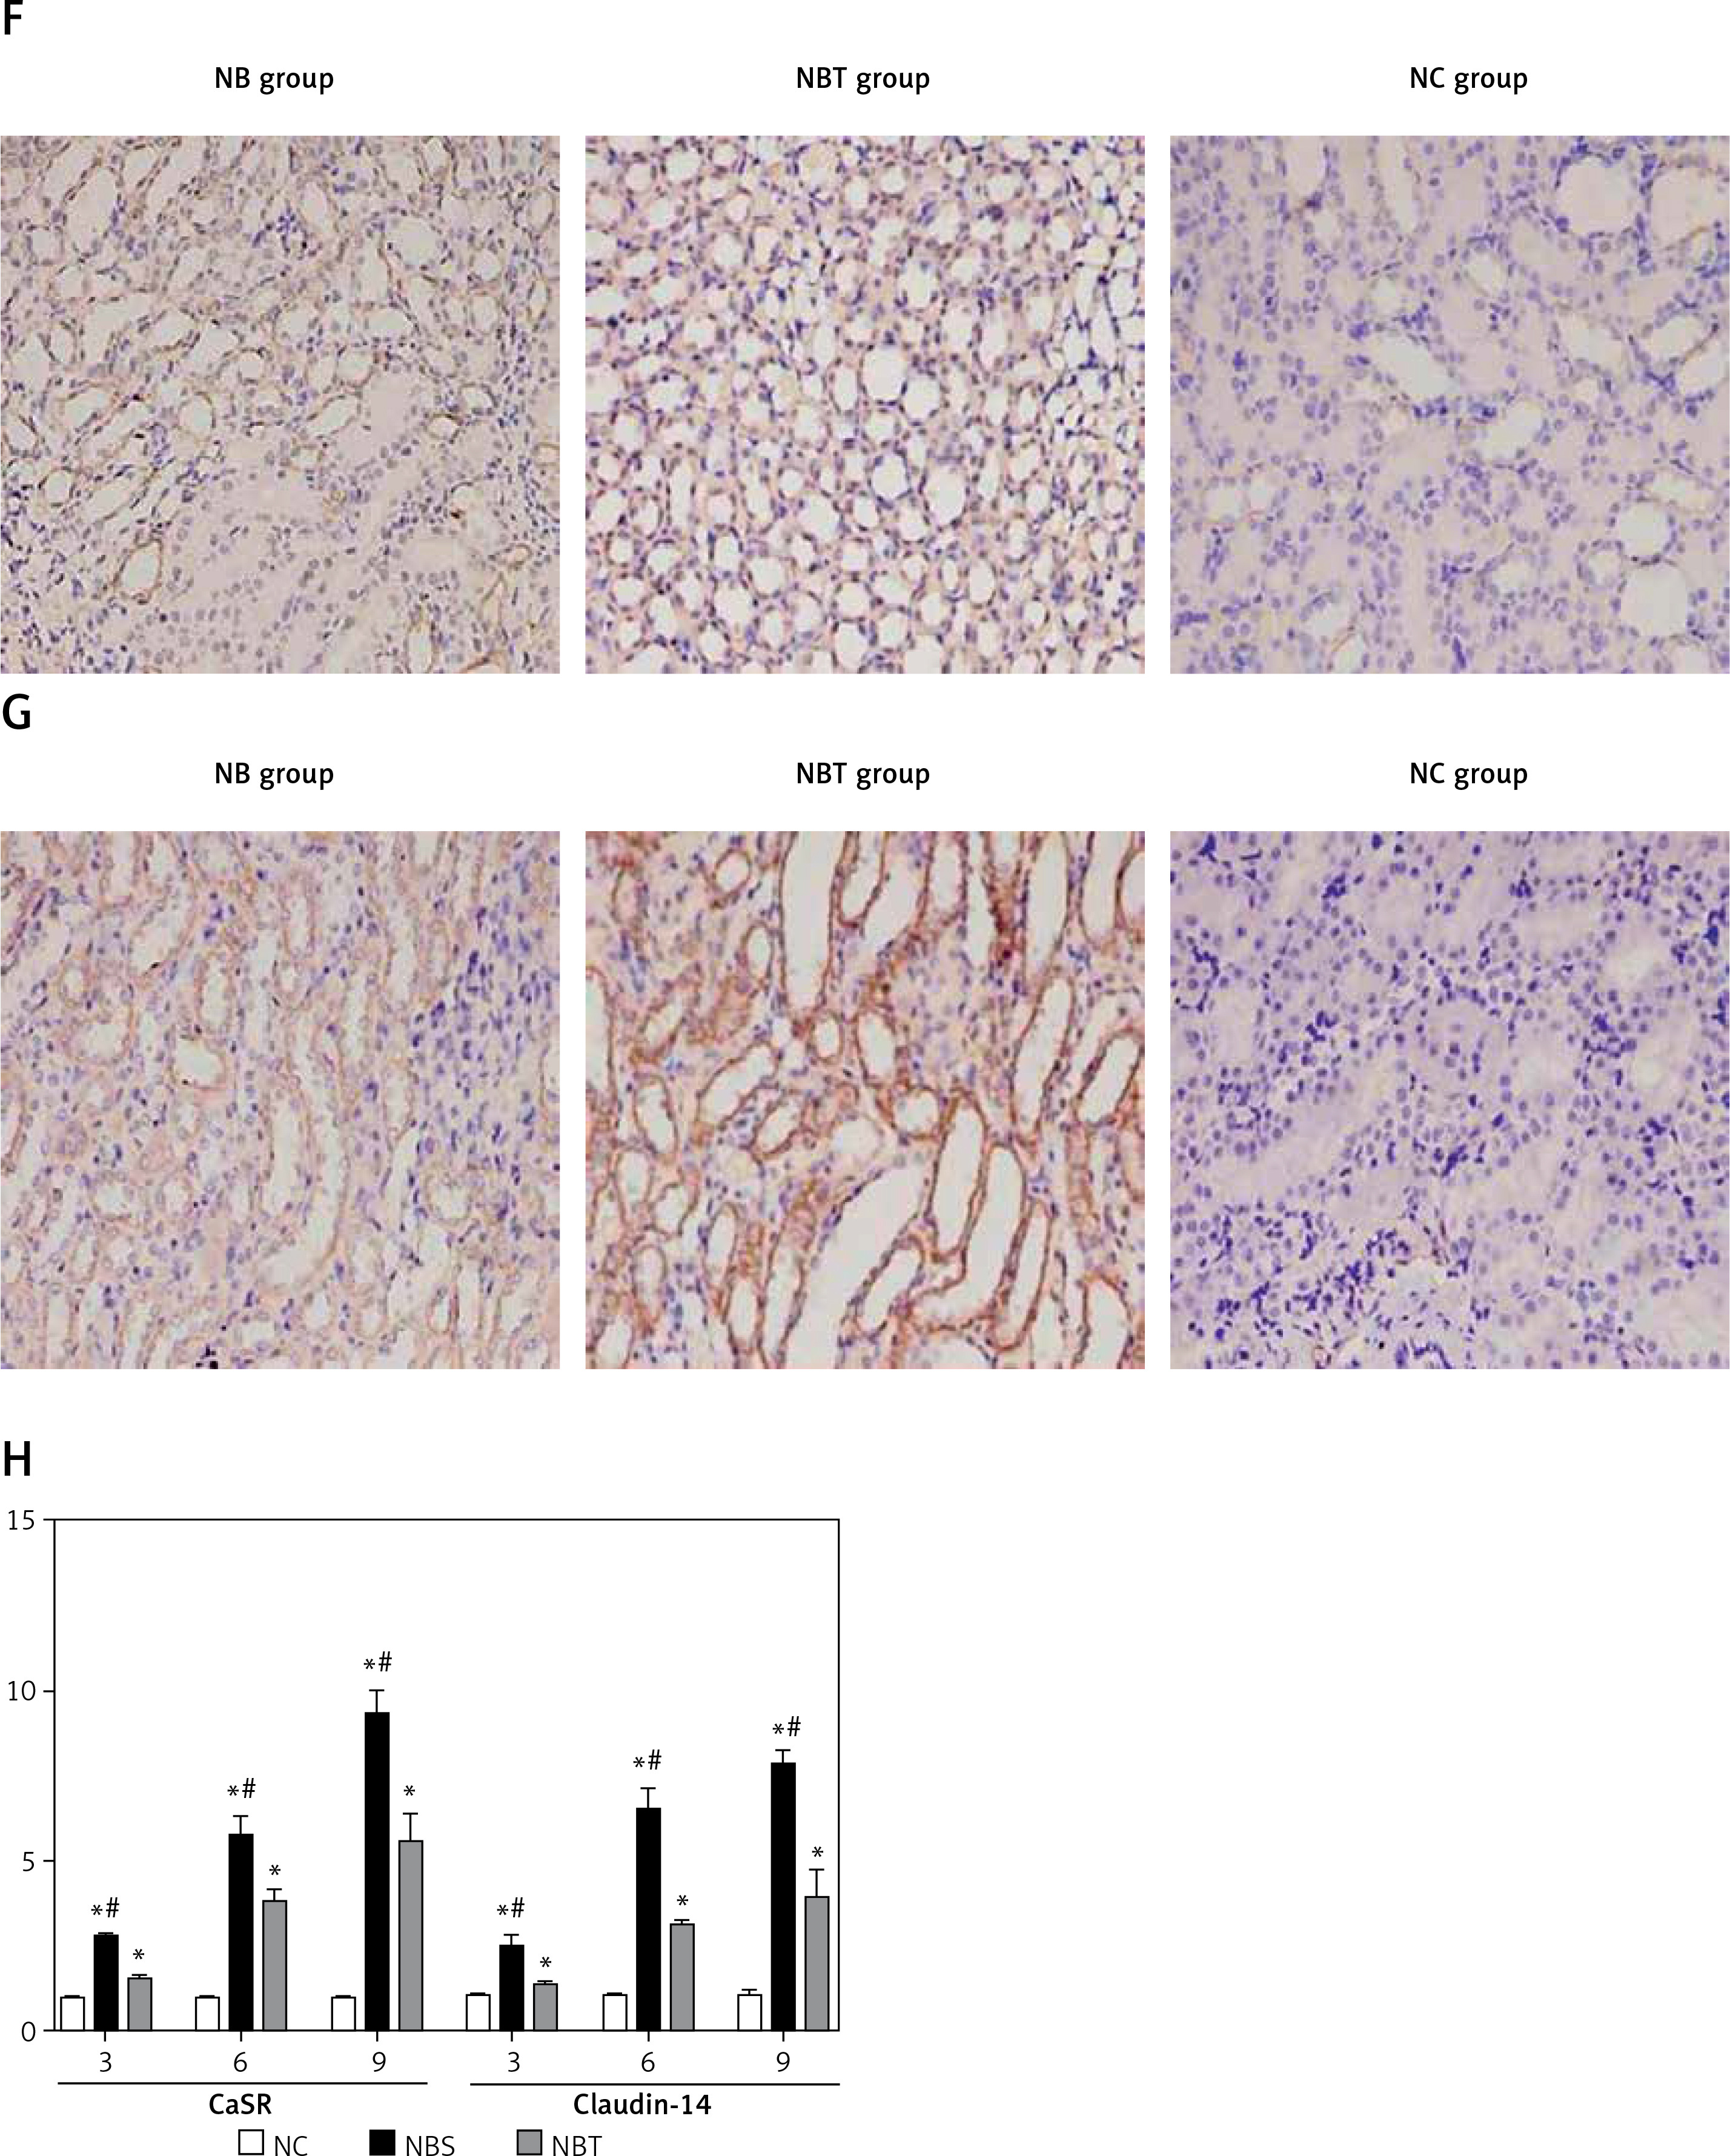
F – Positive expression of CaSR in kidney tissues of Wistar male rats (immunohistochemistry 200×). G – Positive expression of Claudin-14 in kidney tissues of Wistar male rats (immunohistochemistry 200×). H – Comparison of CaSR and Claudin-14 mRNA expression in each group at different time points (n = 3)
There were no significant differences in the renal body ratio between the groups from week 1 to week 7, and there was no significant difference between the 8th and 10th week. The difference between the nanobacteria group and the control group was statistically significant (p < 0.05; Table I).
Table I
Renal body ratio of each group
| Renal body ratio | Time [weeks] | |||||||||
|---|---|---|---|---|---|---|---|---|---|---|
| 1 | 2 | 3 | 4 | 5 | 6 | 7 | 8 | 9 | 10 | |
| NC | 0.67 ±0.04 | 0.71 ±0.02 | 0.76 ±0.05 | 0.81 ±0.02 | 0.83 ±0.05 | 0.79 ±0.10 | 0.76 ±0.08 | 0.76 ±0.06* | 0.77 ±0.05* | 0.76 ±0.05* |
| NBT | 0.65 ±0.09 | 0.73 ±0.10 | 0.83 ±0.05 | 0.84 ±0.07 | 0.86 ±0.13 | 0.90 ±0.06 | 0.88 ±0.15 | 0.80 ±0.02 | 0.76 ±0.04# | 0.77 ±0.04# |
| NBS | 0.64 ±0.11 | 0.76 ±0.57 | 0.91 ±0.20 | 0.90 ±0.24 | 0.94 ±0.17 | 0.94 ±0.13 | 0.95 ±0.22 | 0.93 ±0.08 | 0.91 ±0.06 | 0.90 ±0.06 |
Formation of kidney stones
No stones were observed in any of the groups three weeks before the model establishment. At the beginning of the fourth week, the nanobacteria group showed transparent crystals, most of which were distributed in the distal and proximal convoluted tubules. Glomeruli were occasionally visible, and crystals noticeable with an irregular shape such as a sheet or agglomerate were also noticeable. Large crystals were in the form of a sheet or a pile. In the interference group, the crystals of the stones began to appear at the fifth week, and the crystal sites and shapes were similar to those of the nanobacteria group, but the number of crystals was small. In the control group, no kidney stone crystals appeared during the same period (Table II).
Analysis of biochemical blood markers
At the beginning of the third week, the uric acid, urea, and creatinine of the nanobacteria group were increased to different degrees, and they were significantly higher than in the interference group or the control group. The corresponding values of the interference group were also significantly higher than those of the blank group. There was a slight decrease in the 9th–10th week. The nanobacteria group and the blank control group were compared statistically. The results showed that blood calcium at week 6–7, creatinine at week 4–8, uric acid at week 3–8, and urea at week 3–9 all showed statistically significant differences. At p < 0.05, there were no significant differences in the measured levels of the other indicators in the remaining weeks. Blood phosphorus and blood magnesium also did not show any statistically significant differences (p > 0.05; Table III, Figure 1 B).
Table III
Comparison of blood biochemistry in NBS, NBT, and NC groups
| Time [weeks] | Group | Blood calcium [μmol/l] | Blood phosphorus [μmol/l] | Blood magnesium [μmol/l] | Creatinine [μmol/l] | Uric acid [μmol/l] | Urea [μmol/l] |
|---|---|---|---|---|---|---|---|
| 1 | NC | 2.34 ±0.16 | 2.79 ±0.57 | 1.10 ±0.20 | 39.43 ±1.43 | 78.67 ±9.71 | 5.89 ±0.68 |
| NBT | 2.44 ±0.25 | 2.71 ±1.11 | 1.04 ±0.24 | 40.73 ±2.90 | 79.00 ±8.66 | 5.26 ±1.45 | |
| NBS | 2.39 ±0.09 | 2.71 ±0.18 | 1.06 ±0.13 | 41.10 ±3.89 | 85.00 ±13.00 | 5.34 ±1.45 | |
| 2 | NC | 2.39 ±0.11 | 3.54 ±0.87 | 1.18 ±0.31 | 42.40 ±6.46 | 78.67 ±7.37 | 5.71 ±1.10 |
| NBT | 2.39 ±0.17 | 3.85 ±0.94 | 1.11 ±0.16 | 41.70 ±5.98 | 71.67 ±5.86 | 6.15 ±1.37 | |
| NBS | 2.36 ±0.21 | 3.40 ±0.65 | 1.24 ±0.08 | 45.40 ±5.30 | 81.00 ±13.00 | 6.76 ±0.73 | |
| 3 | NC | 2.54 ±0.13 | 3.45 ±1.25 | 1.17 ±0.14 | 42.33 ±1.79 | 72.67 ±4.73# | 5.04 ±0.62 |
| NBT | 2.47 ±0.23 | 3.32 ±0.85 | 1.18 ±0.22 | 45.73 ±5.78 | 79.67 ±9.02 | 5.64 ±2.23 | |
| NBS | 2.52 ±0.07 | 3.04 ±0.24 | 1.10 ±0.11 | 48.57 ±9.80 | 84.67 ±11.02 | 5.93 ±1.02 | |
| 4 | NC | 2.49 ±0.10 | 3.45 ±0.23 | 1.24 ±0.10 | 42.10 ±3.70# | 72.67 ±3.51# | 4.91 ±1.17 |
| NBT | 2.50 ±0.25 | 2.91 ±0.21 | 1.13 ±0.33 | 43.63 ±5.77 | 87.00 ±3.61 | 6.03 ±1.02 | |
| NBS | 2.44 ±0.22 | 3.30 ±0.70 | 1.18 ±0.26 | 50.27 ±4.15 | 91.00 ±9.17 | 6.84 ±1.09 | |
| 5 | NC | 2.47 ±0.16 | 3.34 ±1.22 | 1.13 ±0.45 | 42.53 ±4.93# | 73.00 ±6.24# | 5.72 ±0.87# |
| NBT | 2.49 ±0.42 | 3.20 ±0.89 | 1.08 ±0.26 | 54.47 ±7.43 | 87.67 ±11.50 | 6.34 ±1.68 | |
| NBS | 2.41 ±0.18 | 3.05 ±0.21 | 1.16 ±0.28 | 61.63 ±6.15 | 92.67 ±17.56 | 6.39 ±1.16 | |
| 6 | NC | 2.10 ±0.05a | 2.90 ±0.35e | 1.27 ±0.20 | 45.03 ±4.32# | 82.67 ±4.73# | 5.68 ±0.42# |
| NBT | 2.61 ±0.22 | 2.75 ±0.51d | 1.11 ±0.09 | 51.40 ±8.18 | 91.33 ±7.37 | 6.62 ±0.52 | |
| NBS | 2.41 ±0.09# | 3.73 ±0.21*# | 1.17 ±0.14 | 58.20 ±17.27 | 96.33 ±9.61 | 7.63 ±0.81 | |
| 7 | NC | 2.35 ±0.03c | 2.46 ±0.34 | 1.06 ±0.20 | 49.53 ±3.79# | 80.67 ±3.21# | 5.28 ±0.46# |
| NBT | 2.27 ±0.05b | 2.85 ±0.83 | 1.13 ±0.22 | 51.60 ±6.52 | 85.00 ±15.1 | 6.51 ±0.97 | |
| NBS | 2.43 ±0.07*# | 2.61 ±0.24 | 1.14 ±0.22 | 61.87 ±6.90 | 92.33 ±11.55 | 7.41 ±1.67 | |
| 8 | NC | 2.35 ±0.03 | 2.46 ±0.34 | 1.06 ±0.20 | 49.53 ±3.79# | 80.67 ±3.21# | 5.28 ±0.46# |
| NBT | 2.34 ±0.13 | 2.67 ±1.45 | 1.10 ±0.19 | 54.07 ±9.31 | 87.33 ±11.02 | 6.15 ±0.97 | |
| NBS | 2.35 ±0.13 | 2.69 ±0.21 | 1.05 ±0.17 | 55.60 ±15.90 | 94.33 ±6.11 | 7.49 ±2.30 | |
| 9 | NC | 2.32 ±0.04 | 2.58 ±1.14 | 1.08 ±0.12 | 46.53 ±5.35 | 84.33 ±7.23 | 5.75 ±0.66 |
| NBT | 2.31 ±0.05 | 2.55 ±0.06 | 1.05 ±0.28 | 52.87 ±5.78 | 86.67 ±7.37 | 6.57 ±0.71 | |
| NBS | 2.37 ±0.08 | 2.33 ±0.39 | 1.08 ±0.08 | 53.60 ±11.92 | 86.67 ±8.08 | 6.73 ±1.44 | |
| 10 | NC | 2.42 ±0.27 | 2.59 ±0.42 | 1.20 ±0.15 | 47.07 ±1.46 | 78.67 ±4.16 | 5.70 ±0.87 |
| NBT | 2.43 ±0.10 | 2.86 ±1.58 | 1.15 ±0.28 | 49.60 ±5.15 | 81.00 ±11.27 | 7.23 ±1.13 | |
| NBS | 2.45 ±0.10 | 2.90 ±0.26 | 1.19 ±0.09 | 47.60 ±6.58 | 86.00 ±10.44 | 6.59 ±1.14 |
Comparison of the urine biochemical indicators of the rats
Compared with the interference group and the control group, the urinary calcium in the nanobacteria group began to significantly increase at the third week, and the difference was statistically significant (p < 0.05). At the 9th–10th week, the urinary calcium decreased slightly, and there was no statistically significant difference to the control group. After 8 weeks, the urinary pH value of the nanobacteria group was significantly higher than that of the control group, and the difference was statistically significant (p < 0.05). There was no significant difference in the other weeks. There was no significant difference in the 24-h urine volume and urine-specific gravity (p > 0.05; Table IV, Figure 1 C).
Table IV
Comparison of urine biochemistry between NB, NBT, and NC rats
| Time [week] | Group | Urine calcium [μmol/l] | Urine pH | Urine specific gravity | 24-h Urine output [ml] |
|---|---|---|---|---|---|
| 1 | NC | 1.11 ±0.16 | 6.67 ±0.29 | 1.013 ±0.006 | 7.70 ±0.87 |
| NBT | 1.20 ±0.16 | 7.17 ±0.29 | 1.010 ±0.005 | 6.97 ±0.64 | |
| NBS | 1.23 ±0.30 | 7.17 ±0.29 | 1.013 ±0.003 | 6.67 ±1.20 | |
| 2 | NC | 1.00 ±0.05 | 6.83 ±0.76 | 1.018 ±0.008 | 9.03 ±1.02 |
| NBT | 1.71 ±0.75 | 7.33 ±0.58 | 1.013 ±0.008 | 8.70 ±0.75 | |
| NBS | 1.60 ±0.58 | 7.33 ±0.29 | 1.010 ±0.005 | 7.77 ±2.14 | |
| 3 | NC | 1.59 ±0.27# | 7.33 ±0.58 | 1.018 ±0.003 | 11.30 ±2.88 |
| NBT | 1.75 ±0.52 | 7.17 ±0.29 | 1.015 ±0.009 | 8.77 ±0.98 | |
| NBS | 2.24 ±0.52 | 7.67 ±0.29 | 1.012 ±0.006 | 8.13 ±1.84 | |
| 4 | NC | 2.22 ±0.16 | 6.83 ±0.29# | 1.018 ±0.003 | 10.90 ±2.19 |
| NBT | 2.82 ±0.31# | 7.17 ±0.58 | 1.017 ±0.010 | 9.83 ±2.20 | |
| NBS | 2.64 ±1.34 | 7.50 ±0.50 | 1.015 ±0.005 | 8.87 ±3.17 | |
| 5 | NC | 2.15 ±0.30 | 7.00 ±.087# | 1.018 ±0.003 | 11.23 ±1.32 |
| NBT | 2.70 ±0.37# | 7.00 ±0.50 | 1.018 ±0.003 | 10.30 ±0.36 | |
| NBS | 3.07 ±0.66 | 7.50 ±0.50 | 1.013 ±0.003 | 9.47 ±0.87 | |
| 6 | NC | 2.04 ±0.37# | 6.67 ±0.58 | 1.022 ±0.003 | 11.73 ±0.96 |
| NBT | 2.91 ±0.83 | 7.00 ±0.50 | 1.017 ±0.003 | 10.03 ±1.19 | |
| NBS | 3.09 ±1.12 | 7.33 ±0.58 | 1.017 ±0.008 | 9.53 ±1.31 | |
| 7 | NC | 2.22 ±0.34# | 7.00 ±0.50 | 1.018 ±0.003 | 11.57 ±1.24 |
| NBT | 2.47 ±1.04 | 7.33 ±0.76 | 1.018 ±0.003 | 10.20 ±2.17 | |
| NBS | 3.14 ±0.82 | 7.67 ±0.58 | 1.015 ±0.005 | 9.07 ±1.00 | |
| 8 | NC | 2.19 ±0.44# | 6.80 ±0.29# | 1.020 ±0.005 | 12.63 ±2.47 |
| NBT | 2.23 ±0.63 | 7.50 ±0.00 | 1.017 ±0.003 | 10.00 ±0.61 | |
| NBS | 2.67 ±0.47 | 8.33 ±.29# | 1.015 ±0.005 | 9.27 ±1.35 | |
| 9 | NC | 1.92 ±0.20 | 6.83 ±0.29# | 1.018 ±0.010 | 9.77 ±0.85 |
| NBT | 2.11 ±0.23 | 6.83 ±0.58 | 1.017 ±0.008 | 8.43 ±0.72 | |
| NBS | 2.29 ±0.41 | 8.33 ±0.29 | 1.015 ±0.009 | 8.47 ±1.16 | |
| 10 | NC | 2.01 ±0.21 | 6.67 ±0.73 | 1.020 ±0.005 | 9.80 ±0.46 |
| NBT | 1.99 ±0.15 | 6.67 ±0.29 | 1.018 ±0.008 | 9.60 ±2.61 | |
| NBS | 2.14 ±0.26 | 8.00 ±0.50 | 1.015 ±0.005 | 8.80 ±0.87 |
Comparison of renal pathological changes
Two weeks before modelling, there were no significant differences in the pathological grading of the rats in each group, and there was no crystal formation. At the beginning of the third week, the renal tubular epithelium of the nanobacteria group showed mild expansion, and the epithelial cells showed granular degeneration. The interference group also showed these pathological changes, but they were not as pronounced as in the nanobacteria group, and no pathological changes or crystal formation were observed in the control group. At the beginning of the fourth week, there was obvious expansion of the renal tubules, vacuolar degeneration, swelling of the epithelial cells, and the presence of transparent crystals in the renal tubules, collecting ducts, and renal interstitial cells. Moreover, several regions were bulk and fragmented or showed irregular fragments. At the same time, there was renal tubular epithelial shedding, visible lymphocytic infiltration in the renal interstitium, and the renal sac was rarely seen. Furthermore, with the prolongation of modelling time, kidney damage was further aggravated, and the number of crystals was further increased. These changes were also observed in the interference group, but the degree of damage was lower than in the nanobacteria group, and the number of formed crystals was lower. During the whole modelling period, no obvious pathological changes were observed in the kidneys of the blank control group, and no kidney stone crystals were observed (Figure 1 D).
Electron microscopic observation of kidney samples from each group
At the first and second week of modelling, the renal structure of each group was unremarkable under the electron microscope. At the beginning of the third week, the renal microtubule epithelial cells of the nanobacteria group showed scattered distribution of black particles, which also appeared in the interference group at the same time, but in smaller amounts than in the nanobacteria group. At the seventh week, the renal tubular epithelial cells of the nanobacteria group were surrounded by black crystalline granules, which showed a clump-like distribution. The amounts of black granules in the interference group were lower than that in the nanobacteria group. The blank control group also showed these granules (Figure 1 E).
Expression of CaSR and Claudin-14 in renal tissues
Protein expression of CaSR in renal tissues
During the entire modelling process, CaSR was expressed in all 3 groups. Two weeks before modelling, there were no differences in the expression of CaSR among the 3 groups. At the beginning of the third week, the expression of CaSR in the kidneys of the nanobacteria group began to increase, with diffuse immunoreactivity in the membrane of renal tubular epithelial cells. The protein was also present in the interference group, but there was no strong expression in the nanobacteria group. The expression of CaSR in the blank control group did not change significantly during the whole modelling period (Figure 1 F).
Protein expression of Claudin-14 in renal tissues
Similarly to CaSR, Claudin-14 was expressed in all 3 groups during the whole modelling process. Two weeks before modelling, there were no differences in the expression of Claudin-14 among the 3 groups. At the beginning of the third week, the expression of Claudin-14 in the nanobacteria group began to increase. The enhanced immunoreactivity was diffusely distributed on the tubular epithelial cell membrane. The interference group also expressed the protein, but there was no strong expression in the nanobacteria group. The expression of CaSR in the blank control group did not change significantly during the whole modelling period (Figure 1 G).
mRNA expression of CaSR and Claudin-14 in renal tissues
At the first and second week, there were no significant differences in the expression of CaSR and Claudin-14 mRNA among the 3 groups. The expression of CaSR and Claudin-14 mRNA in the nanobacteria group was significantly higher than in the interference group and the blank control group at the third week, and the difference was statistically significant (p < 0.05). The mRNA expression of CaSR and Claudin-14 in the interference group was significantly different from the control group (p < 0.05; Tables V, VI, Figure 1 H, especially 3, 6, and 9 weeks).
Table V
Comparison of CaSR mRNA expression in each group at different time points
| Group | CaSR mRNA | ||
|---|---|---|---|
| 3 w | 6 w | 9 w | |
| NC | 0.999 ±0.010 | 0.997 ±0.014 | 0.999 ±0.022 |
| NBS | 2.757 ±0.112*# | 5.731 ±0.589*# | 9.313 ±0.714*# |
| NBT | 1.543 ±0.083* | 3.863 ±0.329* | 5.570 ±0.811* |
Western blot analysis of CaSR and Claudin-14 expression
At the first and second week, there were no significant differences in the expression of CaSR and Claudin-14 protein among the 3 groups. At the third week, the protein expression levels of CaSR and Claudin-14 in the nanobacteria group were higher than in the interference group and the blank control group, and the differences were statistically significant (p < 0.05). There was a significant positive correlation between CaSR and Claudin-14 protein expression in the renal tissues of rats in the NBS group (r = 0.961, p < 0.05; Tables VII, VIII, Figures 1 I, J, especially 3rd, 6th, and 9th).
Correlation between CaSR and Claudin-14 protein expression and 24 h urinary calcium excretion
At the first and second week, there were no significant differences in urinary calcium excretion between the 3 groups. There was also no significant difference in CaSR and Claudin-14 expression. At the third week, the levels of urinary calcium as well as the expression of CaSR and Claudin-14 in the nanobacteria group were significantly higher than in the control group. There was a significant positive correlation between CaSR and Claudin-14 protein expression and 24-h urinary calcium excretion (r = 0888 and 0.853, respectively, p < 0.05; Figure 1 K).
Discussion
In this study, a suspension of nanobacteria isolated from the urine of patients with kidney stones was injected into the tail vein of rats, and a kidney stone model was successfully established. The general metabolic indices, renal ultrastructural changes, and kidney stone formation were dynamically studied after nanobacterial infection in rats. To further investigate the mechanism of kidney stone formation in rats infected with nanobacteria, we examined the expression of CaSR protein and its downstream protein Claudin-14, which regulate calcium metabolism.
During the modelling process, the levels of serum creatinine, blood uric acid, urea nitrogen, and urinary calcium in the nanobacteria-treated group were significantly higher than in the interference group (nanobacteria plus antibiotic) and the blank control group at the third week. The difference was statistically significant and increased with time. However, after 8 weeks the indices normalized, and there was no significant difference between the 3 groups. The renal body ratio of the nanobacteria group showed no significantly difference compared with the control group between the first and seventh week. However, at the beginning of the eighth week, the renal body ratio was significantly higher than in the control group, and the difference was statistically significant. This result reflects the macroscopic formation of kidney stones in rats induced by nanobacteria, and the damage to the kidneys showing a gradual increase [16]. In this process, the levels of creatinine, uric acid, urea nitrogen, and urinary calcium rise first. Considering the possible interaction between the body’s own protective mechanisms and nanobacterial infection, the specific mechanism leading to the normalization of indices observed at later stages needs further study.
In a previous study, bacteria from the middle urine of patients with kidney stones were cultured [15]. After the peak of growth at 6–8 weeks, the number of nanobacteria gradually became stable. In this study, the nanobacteria were injected into the tail vein to establish the model, and biochemical changes in the blood and urine were analysed. The changed indices recovered after reaching a peak at 8 weeks. It is possible that nanobacteria grow in renal tubular epithelial cells. With the active proliferation of nanobacteria, the kidneys developed a certain level of damage. However, after 8 weeks the growth of nanobacteria was slow and stable, the impact on the body was reduced, and the body’s self-protection mechanisms were activated. Therefore, kidney function was also restored. In the process of modelling, the biochemical indicators in the blood and urine of the three groups of rats were continuously monitored. Only creatinine, uric acid, urea nitrogen, and urinary calcium were found to change, while the other indicators were not significantly different. Therefore, we considered that after the infection, the nanobacteria mainly colonized the renal tubular mucosa and spread to few other parts, so they had a limited effect on the metabolism of the whole body, which is consistent with the results of other studies [17, 18]. In this study, we chose a clinical dose of tetracycline in the interference group. The body weight of the rats in the interference group was lower than that of the rats in the nanobacteria group, regardless of the pathological damage to the kidneys, and the difference was statistically significant. Tetracycline at a physiological dose can be applied to restrain the nanobacteria [19]. In turn, it leads to the damage of the kidneys.
In this study, the urinary calcium excretion of the nanobacteria-treated group was significantly higher than that of the interference group and the control group at weeks 3–8 (p < 0.05), and the difference was statistically significant. Furthermore, there was no significant difference between the interference group and the control group (p > 0.05). At the beginning of the fourth week, the nanobacteria group showed obvious kidney stone formation. This result indicates that the formation of kidney stones in nanobacteria-infected rats is closely related to high urinary calcium, and tetracycline has been reported to have an obvious inhibitory effect on nanobacteria [20]. The formation of a kidney stones in the nanobacterial model appeared later than in kidney stone models established using ethylene glycol, which showed stone formation at the third week [21]. This result may be related to the slow metabolism of nanobacteria, which leads to slower formation of stones [22]. Additionally, it may also be related to the immune response of the organism induced before the formation of mineralized shells that can protect the nanobacteria [23].
Two weeks before modelling, there was no significant change in the pathological indices of the rats in each group, and no crystal formation was apparent. At the beginning of the third week, the renal tubular epithelium of the nanobacteria group showed mild expansion, and the epithelial cells showed granular degeneration. These changes also occurred in the interference group, but they were not as obvious as in the nanobacteria group. No pathological changes or crystal formation were observed in the control group. At the beginning of the fourth week the nanobacteria-induced stone group (NBS group) showed obvious expansion of the renal tubules, vacuolar degeneration of the cells, swelling of the epithelial cells, and transparent crystals in the renal tubules, collecting ducts, and renal interstitial cells, and a number of regions were bulk and fragmented, or showing irregular fragments. At the same time, there was renal tubular epithelial shedding, renal visible lymphocytic infiltration of interstitial nucleus, and the renal sac was rarely seen. Furthermore, with the prolongation of modelling time, kidney damage was further aggravated, and the number of formed crystals was further increased. These changes were also observed in the interference group, but the degree of damage was lower than in the nanobacteria group, and the amount of formed crystals was smaller. An earlier study found that nanobacteria can form a hydroxyapatite crystal shell under physiological conditions [24], covering the cells to form a calcified protective shell, after which the nanobacteria enter a dormant state. When nanobacteria enter the body, they infect cells via receptor-mediated pinocytosis [25], causing a series of inflammatory pathological reactions. These changes cause damage to the cells, through which crystal adhesion is enhanced, which is an important contributor to crystal formation. Chengfan et al. [16] found that nanobacterial damage to renal tubular epithelial cells is a gradually intensifying process. In this process, the adhesion of cells to the crystal is further enhanced, which is considered to be a key step in the formation of kidney stones [26], accompanied by secondary reactions such as kidney inflammation [27, 28]. The results of this study are consistent with these earlier observations.
Furthermore, the expression of CaSR and Claudin-14 in the kidney tissues of each group was assessed. It was found that the expression of CaSR and Claudin-14 mRNA in the nanobacterial group was higher than in the interference group and the control group at the third week. In the renal tissue of the nanobacteria group, the expression of CaSR and Claudin-14 protein was higher than in the interference group and the control group. There was a positive correlation between CaSR and Claudin-14 protein expression in the kidney tissue of the nanobacterial group. The expression levels of CaSR and Claudin-14 in renal tissues of rats in the nanobacteria group were positively correlated with 24-h urinary calcium excretion, which may be related to the regulatory role of the CaSR-claudin-14 axis in the kidney [29].
In this study, there were no differences in the urinary calcium, CaSR, and Claudin-14 protein expression between the 3 groups of rats in the first 2 weeks. When urinary calcium increased, the expression of CaSR and Claudin-14 also increased. It may be that the nanobacteria first cause damage to the renal tubular epithelial cells, causing a certain reaction, which then activates the expression of CaSR and Claudin-14 protein. However, this hypothesis needs further study. Earlier studies have found that Claudin-14 protein in the kidneys is not expressed under normal conditions, and its expression is enhanced only when the body is dehydrated or when excess calcium ions are ingested [30]. The results of our study suggest that CaSR and Claudin-14 can inhibit calcium ion reabsorption and increase urinary calcium. However, CaSR and Claudin-14 promote the acidification of urine and regulate the reabsorption of water, diluting urine and protecting the kidneys from stone formation. Renal tubular epithelial mucosa reduces crystal adhesion, and the causes of increased CaSR-Claudin-14 expression as well as its role in the formation of kidney stones require further study in the future.
In conclusion, after the nanobacteria infect rats, they aggregate in the kidney, which damages the renal tubular epithelial cells, causing changes in blood and urine biochemical indicators. Due to the damage to renal tubular epithelial cells, the basement membrane is exposed, which enhances the attachment and growth of crystals. Due to the adhesion of nanobacteria and their unique mineralization ability, they can form crystallization nuclei. Additionally, the cells that are shed and necrotic are also involved in the formation of kidney stones. As a consequence, the expression of CaSR and Claudin-14 is upregulated, and it was found to be positively correlated with urinary calcium. However, CaSR and Claudin-14 play a complex role in the formation of kidney stones, which needs further study.