Introduction
In high-risk surgical cases in which haemodynamic parameters change rapidly, such as in cardiopulmonary bypass, a central objective when inducing anaesthesia is to maintain cardiac output and oxygen delivery at appropriate levels.
In general anaesthesia, airway control is provided via laryngoscopy and endotracheal intubation [1]; the receptors in the airway are stimulated by both mechanical and chemical factors during these procedures. Stimulation of these tissues leads to catecholamine discharge via sympathetic adrenergic activation, resulting in increased arterial pressure, heart rate, and arrhythmia [1–6]. This response may aggravate existing pathologies in patients with coronary heart disease, cerebrovascular disease, and/or hypertension, which can lead to life-threatening complications [1, 2, 4, 7].
Current methods used to minimise the negative haemodynamic response caused by laryngoscopy and endotracheal intubation include blocking the activation of sensitive receptors and afferent nerves with local anaesthetic agents, inhibiting the central effects of painful stimuli with opioids, and suppressing efferent pathways and effector receptors with local anaesthetics, β-blockers, calcium channel blockers, and sympathetic ganglion blockers [8].
In this study we aimed to evaluate patient responses, the factors effecting those responses, and changes in haemodynamic parameters following anaesthetic induction and intubation, using either fentanil or remifentanil in conjunction with etomidate to induce anaesthesia, in coronary bypass surgery patients with an ejection fraction lower than 50%.
Material and methods
Our study was conducted on patients undergoing coronary bypass surgery, for which we obtained local Ethics Committee approval. We evaluated 30 patients scheduled to undergo coronary artery surgery, each with an American Society of Anaesthesiologists (ASA) risk classification of II–III. Patients were provided with a volunteer consent form prior to inclusion in the study. Demographic data, ASA, and the presence of any additional diseases were all recorded in the study protocol. Patients with an ejection fraction of less than 20% or more than 50%, those requiring emergency surgery, and those with sensitivities to the drugs used in the study were excluded. All patients were premedicated with a 10 mg Diazem tablet one night before the operation and an intramuscular injection of 0.1 mg/kg morphine sulphate 30 min before the operation. While in the operating room, patients were subjected to ECG and monitored for levels of peripheral oxygen saturation (SpO2) and invasive arterial blood pressure (Drager Primus Anaesthesia Monitor, Lübeck, Germany).
For invasive arterial blood pressure monitoring, a 20 G (gauge) arterial cannula (BD, Faraday Road, Swindon, UK) was used on the radial artery. For fluid infusion, a peripheral venous pathway was created with 18 G and 16 G branulas, through which 5–10 ml/kg/h isotonic sodium chloride was administered. A jugular venous catheter was inserted while the patient was conscious for the purpose of recording CVP. A Flotrac/Vigileo (Edward) monitor was used to measure each patient’s cardiac output via SVV (Stroke Volume Variance) and systemic vascular resistance. BIS monitoring (Aspect Medical Systems Inc., Natick, MA, USA) was used to determine each patient’s hypnotic status and depth of anaesthesia. BIS values ≤ 50 represented a sufficient depth of anaesthesia.
Patients were divided into two groups (n = 15 each). Pre-oxygenation was provided by the application of 100% O2.
The anaesthesia induction protocol for group F (fentanil group) included the following: 1 mg/kg lidocaine (Aritmal® 2%), 0.3 mg/kg etomidate (Etomidate®), 1 µg/kg 60 s bolus dose fentanil (Fentanil®) followed by a 0.1 µg/kg/min fentanil infusion, 0.6 mg/kg rocuronium (Esmeron®). The anaesthesia induction protocol for group R (remifentanil group) included the following: 1 mg/kg lidocaine (Aritmal® 2%), 0.3 mg/kg etomidate (Etomidate®), 1 µg/kg 60 s bolus dose of remifentanil (Ultiva®) followed by a 0.1 µg/kg/min remifentanil infusion, 0.6 mg/kg rocuronium (Esmeron®).
In both groups, etomidate was administered 5 min after opioid infusion via titration at a rate of 20 mg/min until the BIS value decreased to 50. Finally, rocuronium was administered.
During intubation, the degree of chin relaxation, ease of laryngoscopy, vocal cord status, and any presence of movement in the extremities were evaluated for each patient.
Systolic artery pressure (SAP), diastolic artery pressure (DAP), mean arterial pressure (MAP), heart rate (HR), SPO2 (saturation), cardiac output (CO), stroke volume variance (SVV), central venous pressure (CVP), and systemic vascular resistance (SVR) values of all patients were recorded at the following time points: T1 – 5 min before the intubation, T2 – immediately following induction, T3 – immediately following intubation.
Statistical analysis
SPSS 13.00 for Windows version package software (SPSS Inc., Chicago, IL, USA) was used for statistical analyses. For analysis of continuous variables, conformity of normal distribution and homogeneity were tested with the Kolmogorov-Smirnov test. Categorical values were evaluated with the χ2 test, and parametric values were evaluated with the independent samples t-test. Differences in consecutive measurements between the two groups were evaluated with repeated measures of ANOVA. Findings are presented as either mean values ± standard deviation (SD) or as percentages. P-values < 0.05 were accepted as statistically significant.
Results
Between the pre-induction (T1), post-induction (T2), and post-intubation (T3) periods, no significant differences were found between groups for the demographic values of SAP, DAP, MAP, HR, or SAT (p > 0.005) (Table I).
Table I
Comparison of systolic arterial pressure, diastolic arterial pressure, mean arterial pressure, heart rate, and arterial oxygen saturation between fentanil and remifentanil groups during pre-induction, post-induction, and post-intubation periods
There were no significant differences found when comparing intergroup CVP values between T1 and T2, T1 and T3, or T2 and T3 for either the fentanil or remifentanil group (p > 0.05) (Table II). However, statistically significant differences were found when the same values were compared between the two groups in all pre-induction (T1), post-induction (T2), and post-intubation (T3) periods (p < 0.05) (Figure 1).
Table II
Comparison of cardiac output, systemic vascular resistance and central venous pressure between fentanil and remifentanil groups during pre-induction, post-induction, and post-intubation periods
Figure 1
Comparison of central venous pressure between fentanil and remifentanil groups during pre-induction, post-induction, and post-intubation periods

Statistically significant differences were found when intergroup MAP values were compared for both the fentanil and remifentanil groups between both T1 and T2, and T2 and T3 values (p < 0.05) (Table III). Additionally, while a significant difference was found between T1 and T3 in the fentanil group (p < 0.05), no such difference was found in the remifentanil group over the same time points (p > 0.05) (Figure 2).
Table III
Comparison of intergroup parametric values
Figure 2
Comparison of mean arterial pressure between fentanil and remifentanil groups during pre-induction, post-induction, and post-intubation periods
£Intergroup MAP comparison; MAB1(T1) vs. MAB2(T2) p < 0.05.
αIntergroup MAP comparison; MAB2(T2) vs. MAB3(T3) p < 0.05.
≈Intergroup MAP comparison; MAB1(T1) vs. MAB3(T3) p < 0.05.

In both groups, there were significant differences found for intergroup HRs between T1 and T2 (p < 0.05). However, no significant difference was observed for these groups between T1 and T3 (p > 0.05). While there was no significant difference observed in the fentanil group between T2 and T3 (p > 0.05), there was a significant difference observed in the remifentanil group (p < 0.05) (Table III, Figure 3).
Figure 3
Comparison of heart rate between fentanyl and remifentanil groups during pre-induction, post-induction, and post-intubation periods

No significant difference was observed for CO values within the fentanil group between T1 and T2 (p > 0.05), although a significant difference was observed within the remifentanil group over the same time points (p < 0.05). While there was a significant difference observed in the fentanil group between T1 and T3 (p < 0.05), no such difference was observed in the remifentanil group (p > 0.05). Additionally, there was no significant difference observed between T2 and T3 in the fentanil group (p > 0.05); however, a significant difference was observed in the remifentanil group (p < 0.05) (Table IV, Figure 4).
Table IV
Comparison of intergroup arterial oxygen saturation, cardiac output, systemic vascular resistance, and central venous pressure values
Figure 4
Comparison of cardiac output between fentanil and remifentanil groups during pre-induction, post-induction, and post-intubation periods
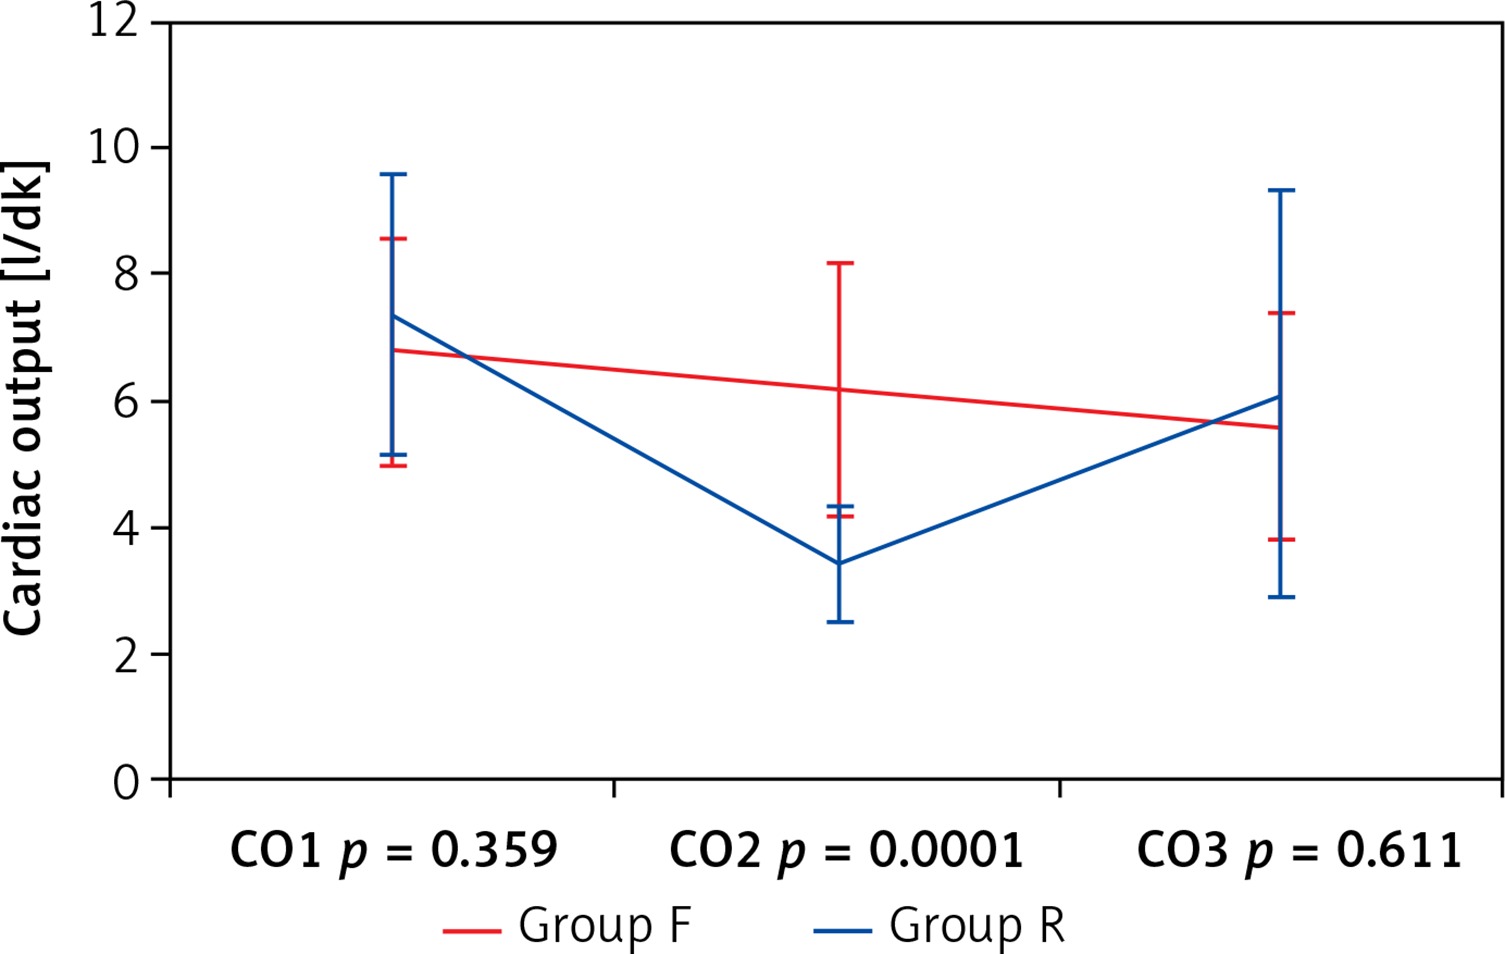
When CO values were compared between the two groups, there was a statistically significant difference found in the post-induction (T2) period (p < 0.05). However, there were no statistically significant differences found for the pre-induction (T1) and post-intubation (T3) periods (p > 0.005) (Figure 4).
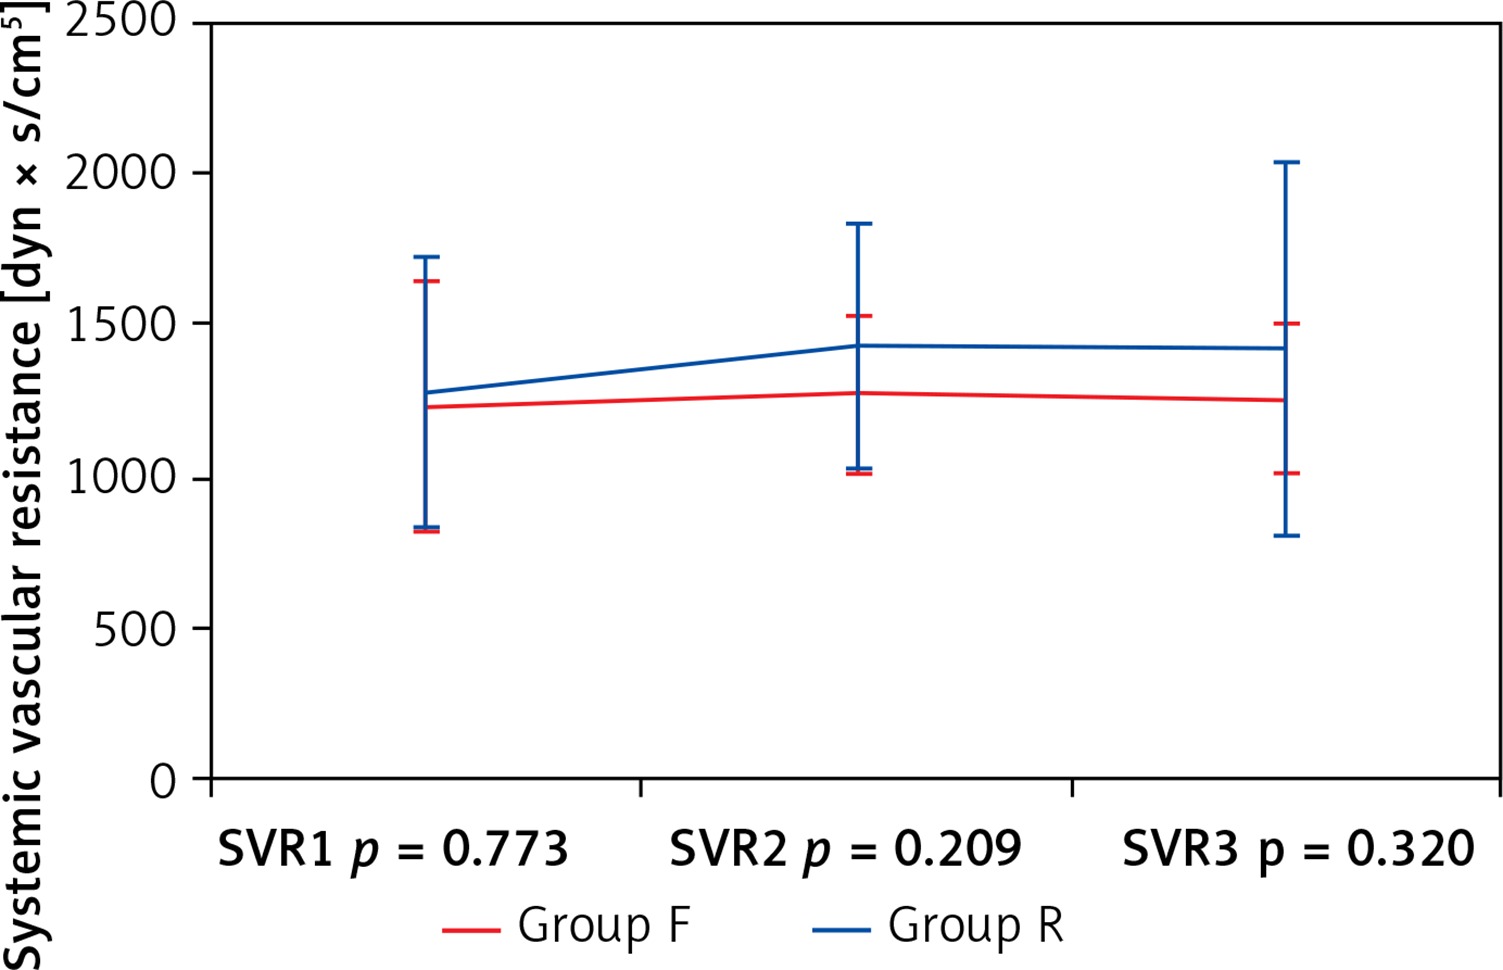
When CVR values were compared between the two groups, there were no statistically significant differences found in either the pre-induction (T1), post-induction (T2), or post-intubation (T3) periods (p > 0.005) (Figure 5).
Figure 5
Comparison of systemic vascular resistance (SVR) between fentanil and remifentanil groups during pre-induction, post-induction, and post-intubation periods
Measurements of the degree of chin relaxation, ease of laryngoscopy, vocal cord status, the presence of cough, and the presence of movement in extremities during intubation were evaluated for each patient. In all patients, chin relaxation was complete, laryngoscopy was easy, and vocal cords were completely immobile. Neither cough nor limb movements were observed in any of the patients during surgery.
Discussion
The pharmaceutical agents used for the induction of anaesthesia commonly lead to decreases in blood pressure, while laryngoscopy and intubation increase haemodynamic parameters.
A central goal during cardiac surgery is the maintenance of adequate tissue perfusion in the patient. A widely used indicator to monitor this adequacy, particularly in patients who are not haemodynamically stable, is the measurement of cardiac output. In the past, measuring cardiac output involved insertion of a pulmonary artery catheter prior to surgery; however, cardiac output can now be measured using the more practical and less invasive Flotrack/Vigileo system. Breukers et al. [9] found that measuring the rate of change in cardiac output obtained over consecutive time periods is a more effective method for determining patient treatment protocols than relying on static cardiac output values. Furthermore, measurements of this rate of change should be similar whether they are obtained using the FloTrac/Vigileo system or by the thermo dilution method because a good correlation has been found between these two techniques. Additionally, increases in vascular tonus, as obtained from measuring cardiac output values using FloTrac/Vigileo equipment, are reflected by small increases in these values; thus, the measurement algorithm retains adequate sensitivity to detect dynamics for this haemodynamic parameter.
Cengiz et al. [10] previously examined patient responses to various remifentanil doses following a 2.5 mg/kg intravenous bolus of propofol. Patients in this study were divided into three groups: group I was administered 0.5 µg/kg remifentanil, group II was administered 1 µg/kg remifentanil, and group III was administered 2 µg/kg remifentanil. While heart rate measurements following intubation were significantly higher than pre-induction values in groups I and II, in group III post-induction heart rates were found to be significantly less than those measured during pre-induction. Overall, as the remifentanil dose was increased, a concomitant decrease in patient heart rates was observed. In the current study, when a 1 µg/kg dose of remifentanil was administered, post-intubation heart rates were found to be significantly higher than post-induction heart rates, and no significant difference was found when comparing these values to pre-induction heart rates.
Güneş et al. [11] compared the effects of remifentanil and fentanil administration in conjunction with desflurane on intracranial intervention patients with regard to intubation, skin incision, haemodynamic changes following implementation of the head holder, and eye opening and response time to verbal commands during extubation at the end of the surgery. While increased haemodynamic values were detected in the fentanil group during intubation, skin incision, and head holder implementation, a more stable haemodynamic profile was observed in the remifentanil group (p < 0.05). In our study, in both the fentanil and remifentanil groups, SAP, DAP, MAP, and HR values decreased during induction and increased during intubation, but there were no significant differences detected between the two groups for these values (p > 0.05). Fluctuations in MAP and HR values were more severe in the remifentanil group; however, the significant decrease in cardiac output values measured for the remifentanil group may be related to the low ejection fraction values of our selected patient group. In patients with normal ejection fractions, Kazmaier et al. [12] found that a high dose of remifentanil significantly decreased heart rate, mean arterial pressure, myocardial blood flow, and systemic vascular resistance values.
Gezer et al. [13] compared patients’ cardiac stability in response to the administration of either remifentanil, alfentanil, or fentanil during anaesthetic induction. Patients were divided into three groups: Group I intravenously received 1 µg/kg remifentanil, group II intravenously received 15 µg/kg alfentanil, and group III intravenously received 2 µg/kg fentanil. Following this, all three groups received 2 mg/kg propofol and 0.6 mg/kg rocuronium. Statistically significant decreases were observed in HR values in groups I and II when comparing time points taken immediately prior to laryngoscopy versus during pre-induction. When intergroup HR values were compared, the HR increases found in groups II and III at 1 min after intubation were found to be statistically significant. However, this study utilised a higher single dose of remifentanil than we used cumulatively over the entirety of the surgical procedure. This may explain the lack of significant difference found between heart rate values in our study. Furthermore, administering etomidate during the induction of anaesthesia (as in our study) may lead to a more balanced induction than propofol in terms of haemodynamic stability. In particular, considering that our patients had poor ventricular function, the use of etomidate may be even more effective at preserving cardiac stability than direct comparison with previous studies might indicate.
Zhang and Sun [14] compared how the use of fentanil, remifentanil, or alfentanil in conjunction with etomidate during anaesthetic induction affected patients’ haemodynamic parameters during elective abdominal surgery. A total of 90 ASA I-II patients were divided into three groups: group F patients received 1 µg/kg fentanil as a 60-second bolus dose, group R patients received 1 µg/kg remifentanil as a 60-second bolus dose, and group A patients received 0.1 µg/kg sufentanil as a 60-second bolus dose. Doses were continued at 0.1, 0.1, and 0.01 µg/kg/min, respectively, as continuous infusions. Blood pressure and heart rate values were recorded at five different time points. While endotracheal intubation led to significant increases in blood pressure and heart rate in groups F and S, there was no significant change observed in group R (p < 0.01), although greater haemodynamic changes occurred in group F than in the other groups (p < 0.01). In group R, there was an average heart rate decrease of more than 30% following induction (p < 0.01). Thus, remifentanil was observed to be the most effective choice for suppressing the development of cardiovascular response following endotracheal intubation. In our study, however, though the use of fentanil and remifentanil led to equivalent post-induction heart rate decreases amongst patients, any increases in heart rate that were measured following intubation were not found to be significant in the fentanil group. However, these measurements were significant in the remifentanil group, which suggests that remifentanil may not be as successful at providing haemodynamic stability as the Zhang study suggests.
There is controversy in the literature as to whether fentanil is effective for preventing the hypertension and tachycardia that develop during endotracheal intubation and laryngoscopy. For example, Splinter and Cervenko [15], Chung and Evans [16], and Chung et al. [17] all reported that fentanil is effective at preventing HR and SAP increases when administered at a range of doses (all at 5 µg/kg or less) either immediately prior to or during intubation. However, Kautto [18] found that while 2 µg/kg of fentanil significantly controlled patients’ arterial pressure and heart rate measurements, a 6 µg/kg dose was unable to provide the same effect. In the current study, we administered fentanil at a dose of 1 µg/kg, 5 min prior to intubation. Similar to what was found in previous studies, we concluded that at this dose fentanil was able to prevent both hypertension and tachycardia from developing during endotracheal intubation and laryngoscopy.
Howie et al. [19] compared the effects of three different remifentanil doses on coronary artery bypass patients with poor left ventricle function. For this study, 72 patients were divided into three groups: group 1 patients (n = 23) received a 1 µg/kg/min remifentanil infusion, group 2 patients (n = 24) received a 2 µg/kg/min remifentanil infusion, and group 3 patients (n = 25) received a 3 µg/kg/min remifentanil infusion. If a sufficient depth of anaesthesia was not obtained using these doses, then additional remifentanil was given in either 1–2 µg/kg bolus doses or infusion increases, and 0.5–1.0% isoflurane was administered. Remifentanil alone (whether by infusion or bolus administration) prevented haemodynamic reflex responses in 44% of the patients in group 3, 37% in group 2, and 9% in group 1. Hypotension developed in 64–75% of patients. In coronary bypass surgery patients with poor left ventricle function who were premedicated with lorazepam, effective anaesthesia was obtained with a 2–4 µg/kg/min remifentanil infusion and the administration of occasional low concentration isoflurane. In our study, there were significant decreases in both mean arterial pressure and heart rate values following induction, and these values significantly increased after intubation following a 1 µg/kg bolus or a 0.1 µg/kg/min remifentanil infusion. Neither of these dosing strategies prevents haemodynamic reflex responses.
In conclusion, in this study, we compared the effects on haemodynamics and intubation responses following the use of either fentanil or remifentanil during anaesthetic induction in patients with an ejection fraction of less than 50% while they underwent coronary bypass surgery. Decreased cardiac output levels and increased fluctuations in heart rate and mean arterial pressures were observed following the administration of remifentanil. It is important to note that, although achieving an appropriate dose titration is an important consideration when using opioid agents for anaesthesia, the proper selection of hypnotic agent to use in conjunction with a given opioid is extremely important as well. Although many studies that have employed remifentanil during the induction of anaesthesia have concluded that it is as safe as fentanil when appropriately titrated to the patient, our study suggests that fentanil may be a more appropriate choice during this period in patients presenting with a low ejection fraction.